Special Topics
Table of Contents
- Figure 4.3.1 Trading Statistics by Account Owner Type, 2023
- Figure 4.3.2 Average Percentage of Daily Orders Placed by Customer Account Owner Type, 2023
- Table 4.3.3 Average Daily Orders Placed by Customer Account Owner Type, 2023
- Figure 4.3.4 Percentage of Orders Placed by Instrument Type and Customer Account Owner Type, 2023
- Table 4.3.5 Orders Placed by Instrument Type and Customer Account Owner Type, 2023
4.1 Changes in Registration Type
Table 4.1.1 Registered Representatives - Changes in Registration Type, 2022-20231
(Counts as of year-end)
To: 2023 Registration Type (Year-End) | ||||||
|---|---|---|---|---|---|---|
BD Rep Only | Dual Rep | IA Rep Only | No Longer Registered | 2022 Totals | ||
From: | BD Rep Only | 265,820 | 11,162 | 421 | 31,829 | 309,232 |
Dual Rep | 2,436 | 293,918 | 3,382 | 12,581 | 312,317 | |
IA Rep Only | 118 | 1,065 | 74,144 | 5,645 | 80,972 | |
Not Yet Registered | 41,031 | 13,452 | 7,237 | N/A | 61,720 | |
| 2023 Totals | 309,405 | 319,597 | 85,184 | 50,055 |
|
Source: Financial Industry Regulatory Authority.
1Each cell in the table provides the number of representatives having a given year-end 2022 registration status and a given year-end 2023 registration status. Cells shaded in gray are for representatives with the same registration status at year-end 2022 and year-end 2023. Cells not shaded in gray are for representatives with a different registration status at year-end 2022 and year-end 2023. For example, in the first row there are: 1) 265,820 BD Rep Only at year-end 2022 who remain BD Rep Only at year-end 2023; 2) 11,162 BD Rep Only at year-end 2022 who are Dual Rep at year-end 2023; 3) 421 BD Rep Only at year-end 2022 who are IA Rep Only at year-end 2023; and 4) 31,829 BD Rep Only at year-end 2022 who are no longer registered at year-end 2023. Not Yet Registered represents registered representatives that were not yet registered as of year-end 2022.
4.2 Firm Size
Table 4.2.1 FINRA-Registered Firms - Changes in Firm Size, 2022-20231
(Counts as of year-end)
To: 2023 Firm Size (Year-End) | ||||||
|---|---|---|---|---|---|---|
Small Firm | Mid-Size Firm | Large Firm | No Longer Registered | 2022 Totals | ||
From: | Small Firm | 2,825 | 15 | 0 | 182 | 3,022 |
Mid-Size Firm | 8 | 173 | 4 | 5 | 190 | |
Large Firm | 1 | 10 | 151 | 3 | 165 | |
Not Yet Registered | 111 | 0 | 0 | N/A | 111 | |
| 2023 Totals | 2,945 | 198 | 155 | 190 |
|
Source: Financial Industry Regulatory Authority.
1Each cell in the table provides the number of firms having a given firm size at year-end 2022 and at year-end 2023. Cells shaded in gray are for firms with the same size at year-end 2022 and year-end 2023. Cells not shaded in gray are for firms with a different size at year-end 2022 and year-end 2023. For example, in the first row there are: 1) 2,825 small firms at year-end 2022 that remain small firms at year-end 2023; 2) 15 small firms at year-end 2022 that are mid-size firms at year-end 2023; 3) 0 small firms at year-end 2022 that are large firms at year-end 2023; and 4) 182 small firms at year-end 2022 that are no longer registered with FINRA at year-end 2023. Not Yet Registered with FINRA represents firms that were not yet registered with FINRA as of year-end 2022.
Figure 4.2.2 FINRA-Registered Firms – Total Revenues and Expenses by Firm Size, 2019−2023
(In millions of U.S. dollars as of year-end)
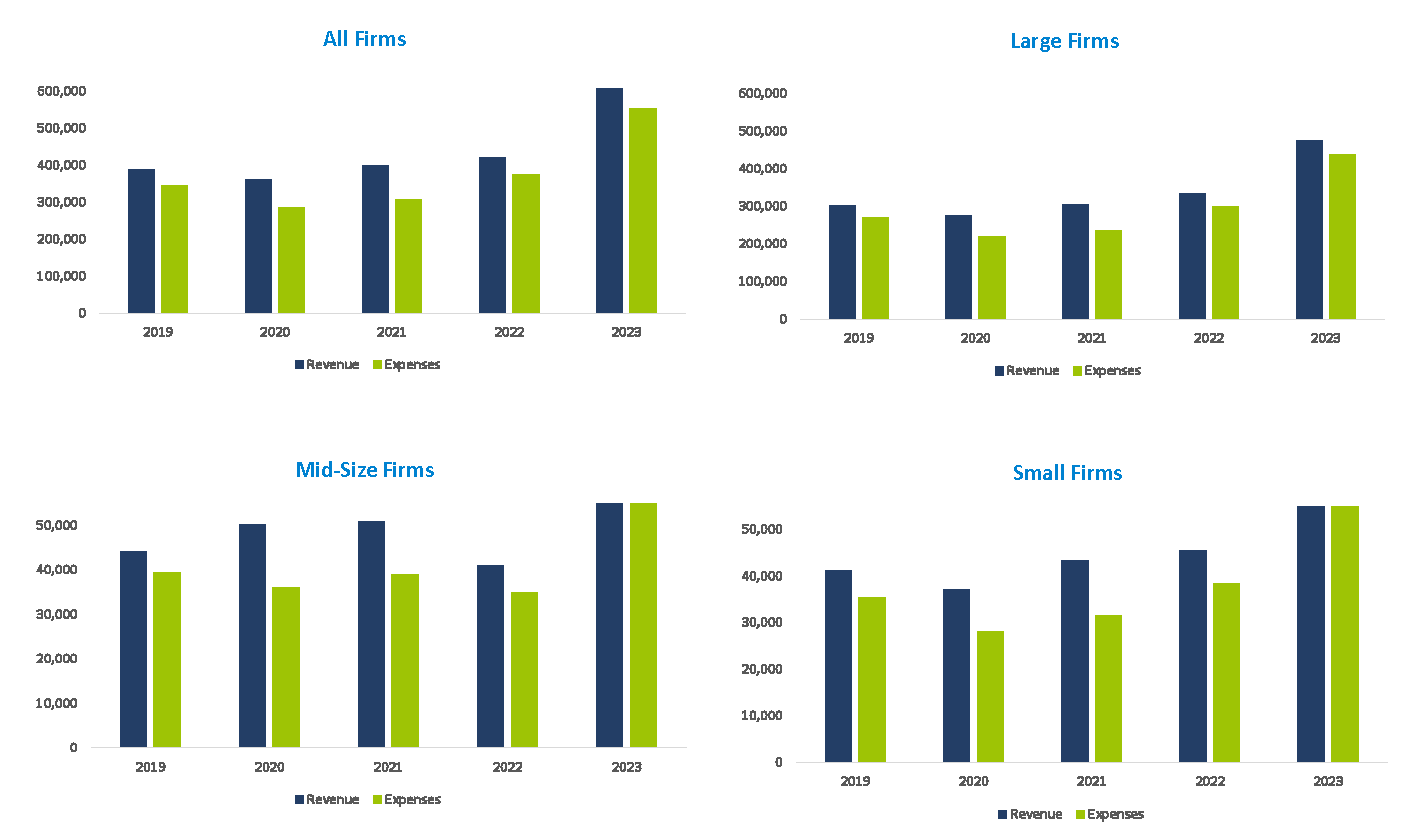
Source: Financial and Operational Combined Uniform Single (FOCUS) Reports.
4.3 Account Owner Type
Figure 4.3.1 Trading Statistics by Account Owner Type, 20231
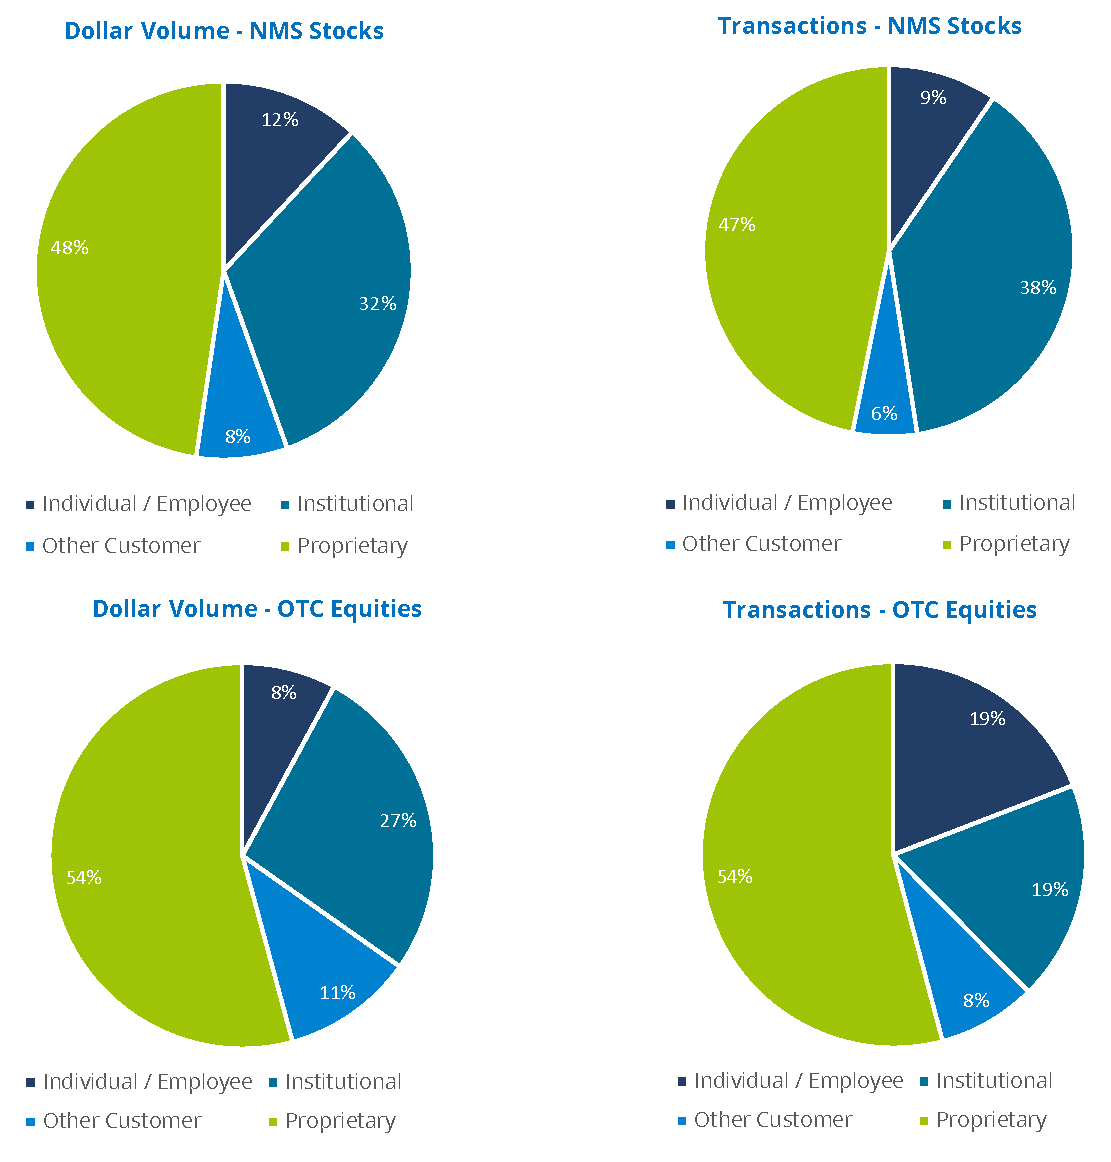
Source: Financial Industry Regulatory Authority. Data as of February 2024.
1Data is based on trades reported to CAT and processed by FINRA. Account Owner Type follows the "accountHolderType" categories in the CAT Reporting Technical Specifications for Industry Members. Other Customer represents activity of Foreign or Firm Agency Account types or activity associated with multiple customer types (non-proprietary). Proprietary represents activity of Proprietary, Market Making or Error Account types or activity associated with multiple non-customer types.
Figure 4.3.2 Average Percentage of Daily Orders Placed by Customer Account Owner Type, 20231
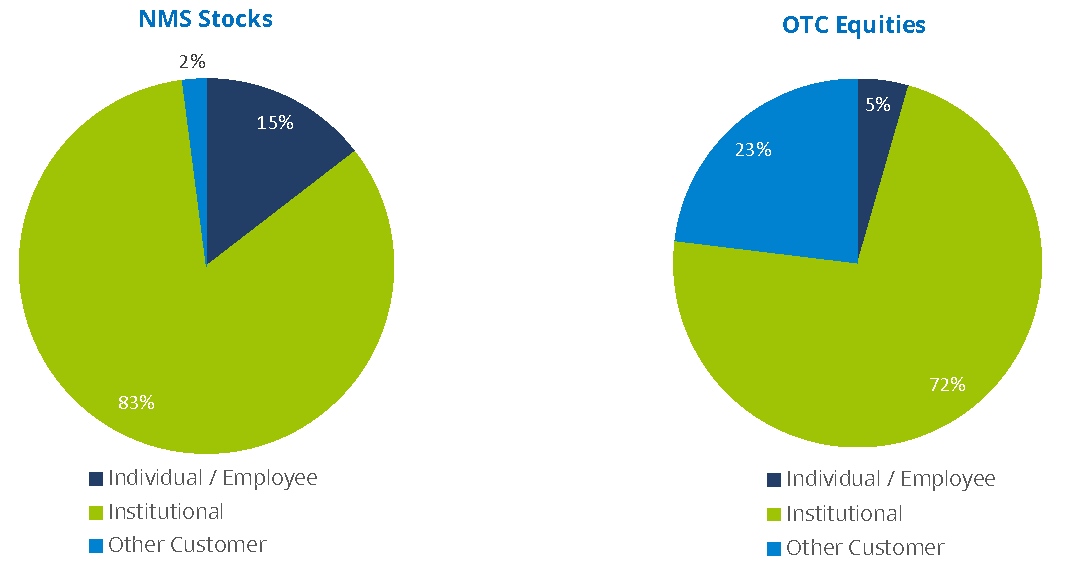
Source: Financial Industry Regulatory Authority. Data as of February 2024.
1Data is based on unique Customer New Order activity as reported by Industry Members to CAT and processed by FINRA. Account Owner Type follows the "accountHolderType" categories in the CAT Reporting Technical Specifications for Industry Members. Other Customer represents activity of Foreign or Firm Agency Account types.
Table 4.3.3 Average Daily Orders Placed by Customer Account Owner Type, 20231
(In millions)
NMS Stocks | OTC Equities | |
|---|---|---|
| Individual / Employee | 142.0 | 1.0 |
| Institutional | 813.7 | 15.7 |
| Other Customer | 19.9 | 5.0 |
| Total | 975.5 | 21.7 |
Source: Financial Industry Regulatory Authority. Data as of February 2024.
1Data is based on unique Customer New Order activity as reported by Industry Members to CAT and processed by FINRA. Account Owner Type follows the "accountHolderType" categories in the CAT Reporting Technical Specifications for Industry Members. Other Customer represents activity of Foreign or Firm Agency Account types.
Figure 4.3.4 Percentage of Orders Placed by Instrument Type and Customer Account Owner Type, 20231,2,3,4,5
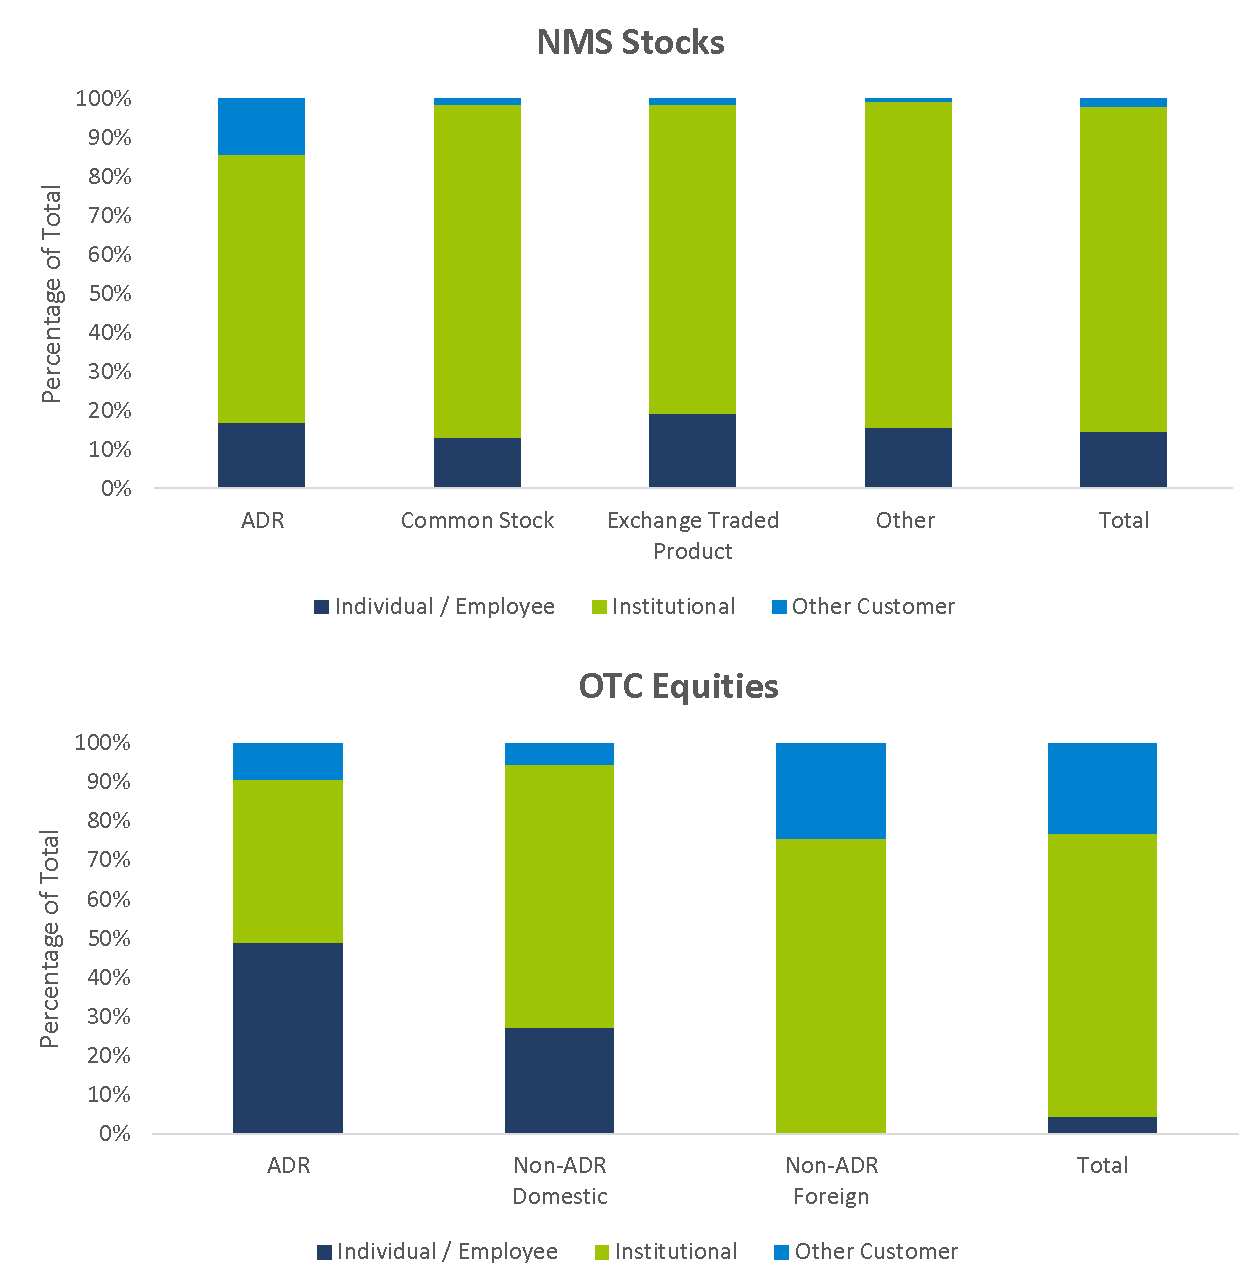
Source: Financial Industry Regulatory Authority. Data as of February 2024.
1Data is based on Customer New Order activity as reported by Industry Members to CAT and processed by FINRA.
2ADR stands for American Depository Receipts and does not include global depository shares.
3The Exchange Traded Products category includes Exchange Traded Funds, Exchange Traded Notes and debt securities traded on an exchange.
4The Other category is primarily made up of real estate investment trusts (REITs), closed ended funds, limited partnerships, preferred stocks, warrants and global depository shares.
5Other Customer represents activity of Foreign or Firm Agency Account types or activity associated with multiple customer types (non-proprietary).
Table 4.3.5 Orders Placed by Instrument Type and Customer Account Owner Type, 20231,2,3,4,5
(In millions)
ADR | Common | Exchange Traded Product | Other | Total | ||
|---|---|---|---|---|---|---|
NMS Stocks | Individual / Employee | 1,870 | 22,910 | 9,479 | 1,230 | 35,489 |
| Institutional | 7,646 | 150,298 | 38,857 | 6,618 | 203,418 | |
| Other Customer | 1,578 | 2,610 | 731 | 60 | 4,979 | |
| Total | 11,094 | 175,817 | 49,067 | 7,908 | 243,886 |
ADR | Non-ADR | Non-ADR | Total | ||
|---|---|---|---|---|---|
OTC Equities | Individual / Employee | 210 | 19 | 14 | 243 |
| Institutional | 179 | 47 | 3,709 | 3,936 | |
| Other Customer | 39 | 4 | 1,211 | 1,254 | |
| Total | 429 | 70 | 4,935 | 5,434 |
Source: Financial Industry Regulatory Authority. Data as of February 2024.
1Data is based on Customer New Order activity as reported by Industry Members to CAT and processed by FINRA.
2ADR stands for American Depository Receipts and does not include global depository shares.
3The Exchange Traded Products category includes Exchange Traded Funds, Exchange Traded Notes and debt securities traded on an exchange.
4The Other category is primarily made up of real estate investment trusts (REITs), closed ended funds, limited partnerships, preferred stocks, warrants and global depository shares.
5Other Customer represents activity of Foreign or Firm Agency Account types or activity associated with multiple customer types (non-proprietary).