Market Activity
Table of Contents
- Table 3.1.1.1 Shares of National Market System (NMS) Stocks Trading Summary, 2019–2023
- Table 3.1.1.2 National Market System (NMS) Stocks Trading by Venue Type, 2020–2023
- Figure 3.1.1.3 Monthly National Market System (NMS) Stocks Trading by Venue Type, 2023
- Figure 3.1.1.4 Monthly National Market Systems (NMS) Stocks Trading Outside of Normal Hours
- Table 3.1.1.5 National Market System (NMS) Stocks Trading by Product Type, 2023
- Table 3.1.2.1 Over-the-Counter (OTC) Equities Market Statistics, 2019−2023
- Figure 3.1.2.2 Monthly OTC Equities Trading by Venue Type, 2023
3.1.3 Market Activity for Equities Traded by Listing Status- Figure 3.1.3.1 Monthly Dollar Volume of Equities Traded (ADR vs. Non-ADR) by Listing Status, 2023
- Figure 3.2.1 Options Trading Activity By Originating Account Owner Type, 2023
- Figure 3.2.2 Put/Call Ratio by Volume and Transaction Count, 2023
- Table 3.3.1 TRACE Reported Fixed Income Activity by Product Type and Venue Type, 2020−2023
- Figure 3.3.2 Monthly TRACE Reported Fixed Income Activity By Product Type and Venue Type, 2023
- Figure 3.3.3 Monthly U.S. Treasuries Dollar Volumes by Participant-to-Trade Type and Product Type, 2023
- Figure 3.3.4 U.S. Treasuries Dollar Volumes by Product Type and Participant-to-Trade Type, 2023
- Figure 3.4.1 FINRA-Registered Firms – Customer Margin Balances, 2019−2023
3.1.1 National Market System
FINRA collects certain market data as part of its role in overseeing trading and providing transparency services. Following are select tables drawn from that data.
Table 3.1.1.1 Shares of National Market System (NMS) Stocks Trading Summary, 2019–2023
Year | Total Consolidated Shares Volume | Total OTC Shares Volume1 | % OTC |
|---|---|---|---|
2019 | 1,771,096,807,512 | 659,344,146,179 | 37.2% |
2020 | 2,773,109,114,496 | 1,150,323,435,489 | 41.5% |
2021 | 2,874,893,079,386 | 1,255,101,462,172 | 43.7% |
2022 | 2,980,822,029,407 | 1,250,660,913,156 | 42.0% |
2023 | 2,760,416,311,642 | 1,214,477,141,961 | 44.0% |
Source: UTP Trade Data Feed and Consolidated Tape System. Data as of February 2024.
1OTC includes all FINRA facilities (the FINRA/Nasdaq TRF, the FINRA/NYSE TRF and the FINRA Alternative Display Facility).
Table 3.1.1.2 National Market System (NMS) Stocks Trading by Venue Type, 2020–20231,2
2020 | 2021 | 2022 | 2023 | ||
|---|---|---|---|---|---|
Avg. Daily | Exchange | 43,086,738 | 51,276,383 | 51,447,764 | 51,697,501 |
| Alternative Trading Systems | 6,283,268 | 7,791,035 | 7,866,283 | 11,905,844 | |
| Non-Alternative Trading Systems OTC | 9,282,650 | 13,141,709 | 11,667,571 | 10,483,445 | |
| Total | 58,652,656 | 72,209,127 | 70,981,618 | 74,086,791 | |
Avg. Daily Volume | Exchange | 296.3 | 368.0 | 364.7 | 300.3 |
| Alternative Trading Systems | 54.4 | 65.6 | 67.4 | 68.8 | |
| Non-Alternative Trading Systems OTC | 130.4 | 153.9 | 181.0 | 147.4 | |
| Total | 481.1 | 587.5 | 613.1 | 516.5 |
Source: Financial Industry Regulatory Authority. Data as of February 2024.
1Data from before H2 2021 is based on OATS data. From H2 2021 onward, it is based on trading activity reported to CAT and processed by FINRA.
2The 2023 data column was updated in October 2024 to correct an error.
Figure 3.1.1.3 Monthly National Market Systems (NMS) Stocks Trading by Venue Type, 20231,2,3
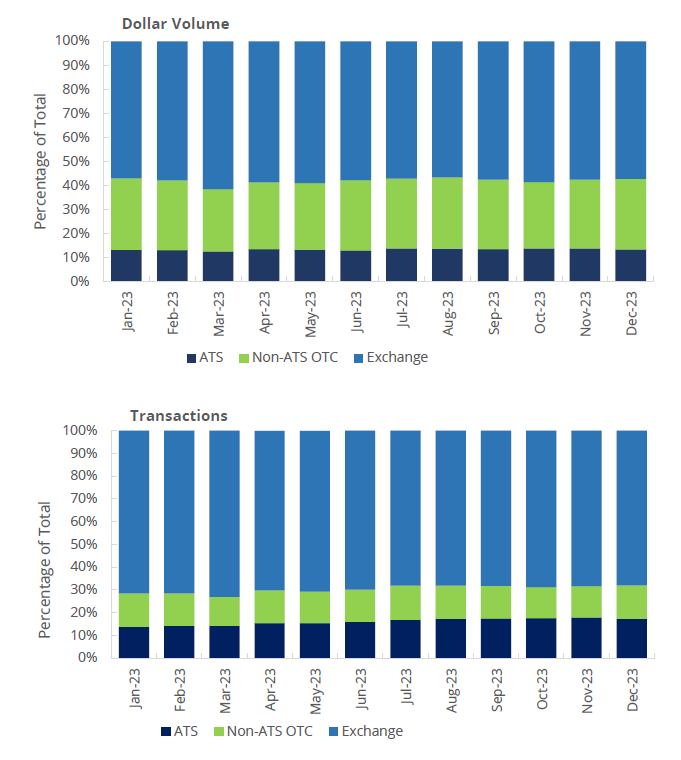
Source: Financial Industry Regulatory Authority. Data as of February 2024.
1Data is based on trading activity reported to CAT and processed by FINRA.
2ATS stands for Alternative Trading Systems.
3The December 2023 data was updated in October 2024 to correct an error.
Figure 3.1.1.4 Monthly National Market Systems (NMS) Stocks Trading Outside of Normal Hours, 20231,2,3
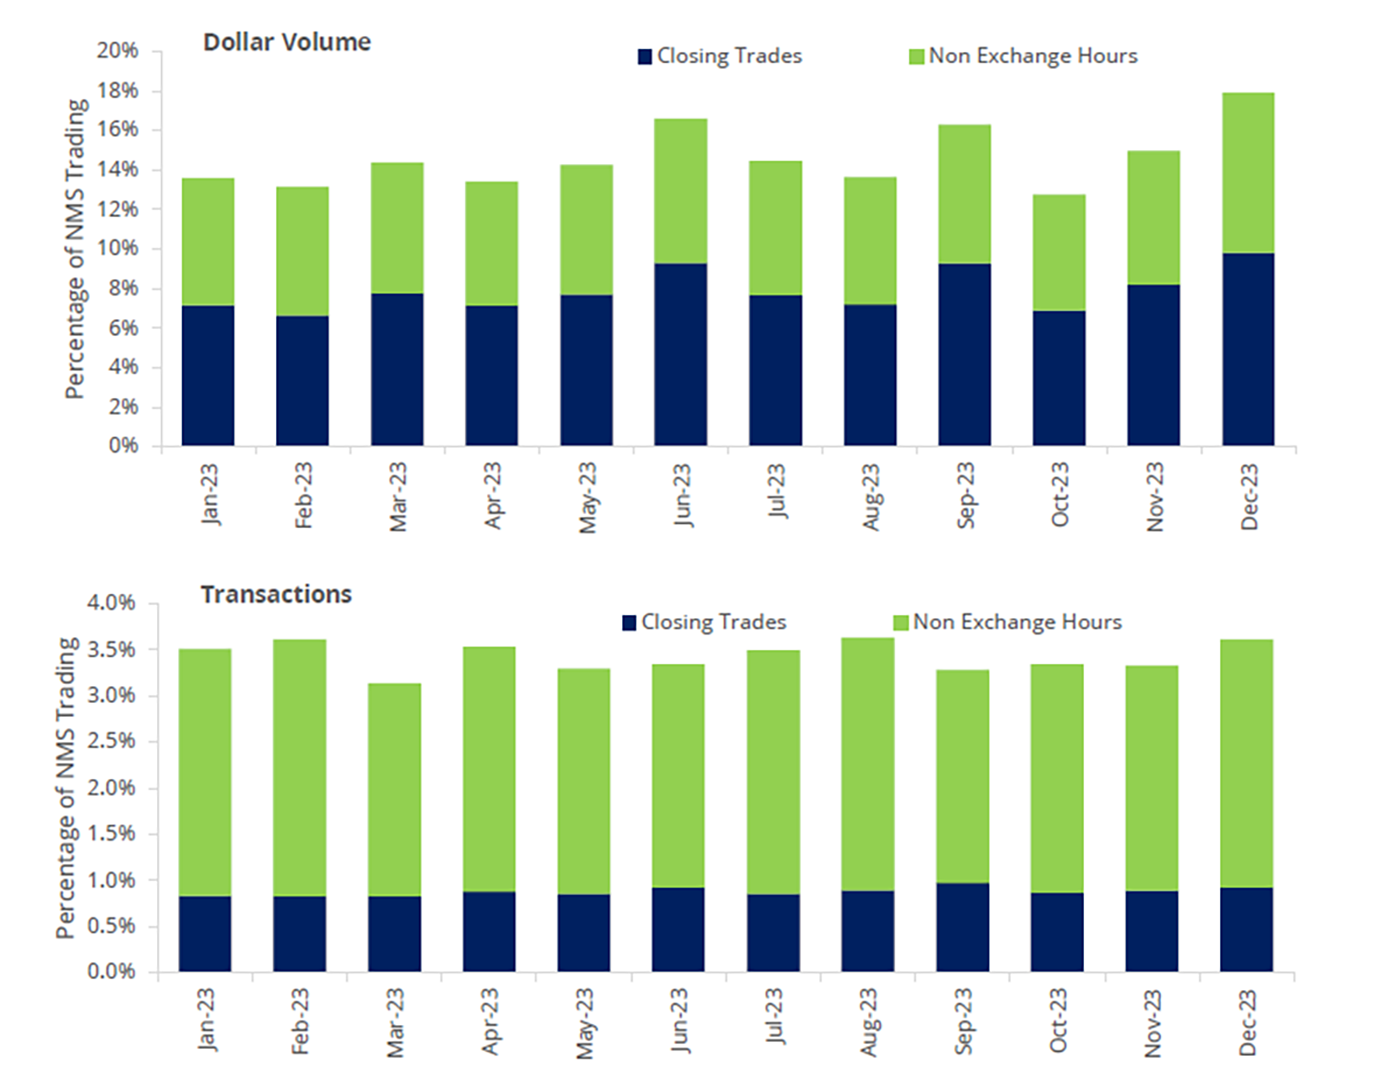
Source: Financial Industry Regulatory Authority. Data as of February 2024.
1Data is based on trading activity reported to CAT and processed by FINRA.
2Closing trades are trades executed in an exchange's closing auction and are timestamped post-close.
3The December 2023 data was updated in October 2024 to correct an error.
Table 3.1.1.5 National Market System (NMS) Stocks Trading by Product Type, 20231
Dollar Volumes by Subtype (in $ billions) | ||||
|---|---|---|---|---|
Month | ADR2 | Common Stock | ETP3 | Other4 |
January | 354 | 6,138 | 2,952 | 187 |
February | 320 | 6,582 | 2,932 | 187 |
March | 401 | 7,920 | 4,277 | 246 |
April | 275 | 5,525 | 2,561 | 167 |
May | 331 | 7,247 | 3,106 | 197 |
June | 306 | 7,888 | 3,184 | 212 |
July | 323 | 7,172 | 2,846 | 190 |
August | 335 | 7,555 | 3,285 | 191 |
September | 290 | 6,563 | 2,868 | 185 |
October | 312 | 7,141 | 3,875 | 194 |
November | 318 | 7,078 | 3,253 | 194 |
December | 317 | 7,502 | 3,413 | 222 |
Source: Financial Industry Regulatory Authority. Data as of February 2024.
1Data is based on trading activity reported to CAT and processed by FINRA.
2ADR stands for American Depository Receipts, and does not include global depository shares.
3ETP stands for Exchange Traded Products, and includes Exchange Traded Funds, Exchange Traded Notes and debt securities traded on an exchange.
4"Other" is primarily made up of real estate investment trusts (REITs), closed ended funds, limited partnerships, preferred stocks, warrants and global depository shares.
3.1.2 OTC Equity
Table 3.1.2.1 Over-the-Counter (OTC) Equities Market Statistics, 2019−20231
Year | Average Daily OTC Equities Share Volume | Average Daily OTC Equities Dollar Volume | Average Daily OTC Equities Transactions |
|---|---|---|---|
2019 | 6,013,676,971 | $1,307,456,314 | 177,445 |
2020 | 11,559,398,546 | $1,793,274,433 | 319,598 |
2021 | 39,554,616,558 | $2,878,628,236 | 623,571 |
2022 | 9,156,103,157 | $2,043,960,223 | 304,617 |
2023 | 4,686,176,205 | $1,564,753,325 | 243,609 |
Source: Financial Industry Regulatory Authority. Data as of February 2024.
1Data from before H2 2021 is based on OATS data. From H2 2021 onward, it is based on trading activity reported to CAT and processed by FINRA.
Figure 3.1.2.2 Monthly OTC Equities Trading by Venue Type, 20231
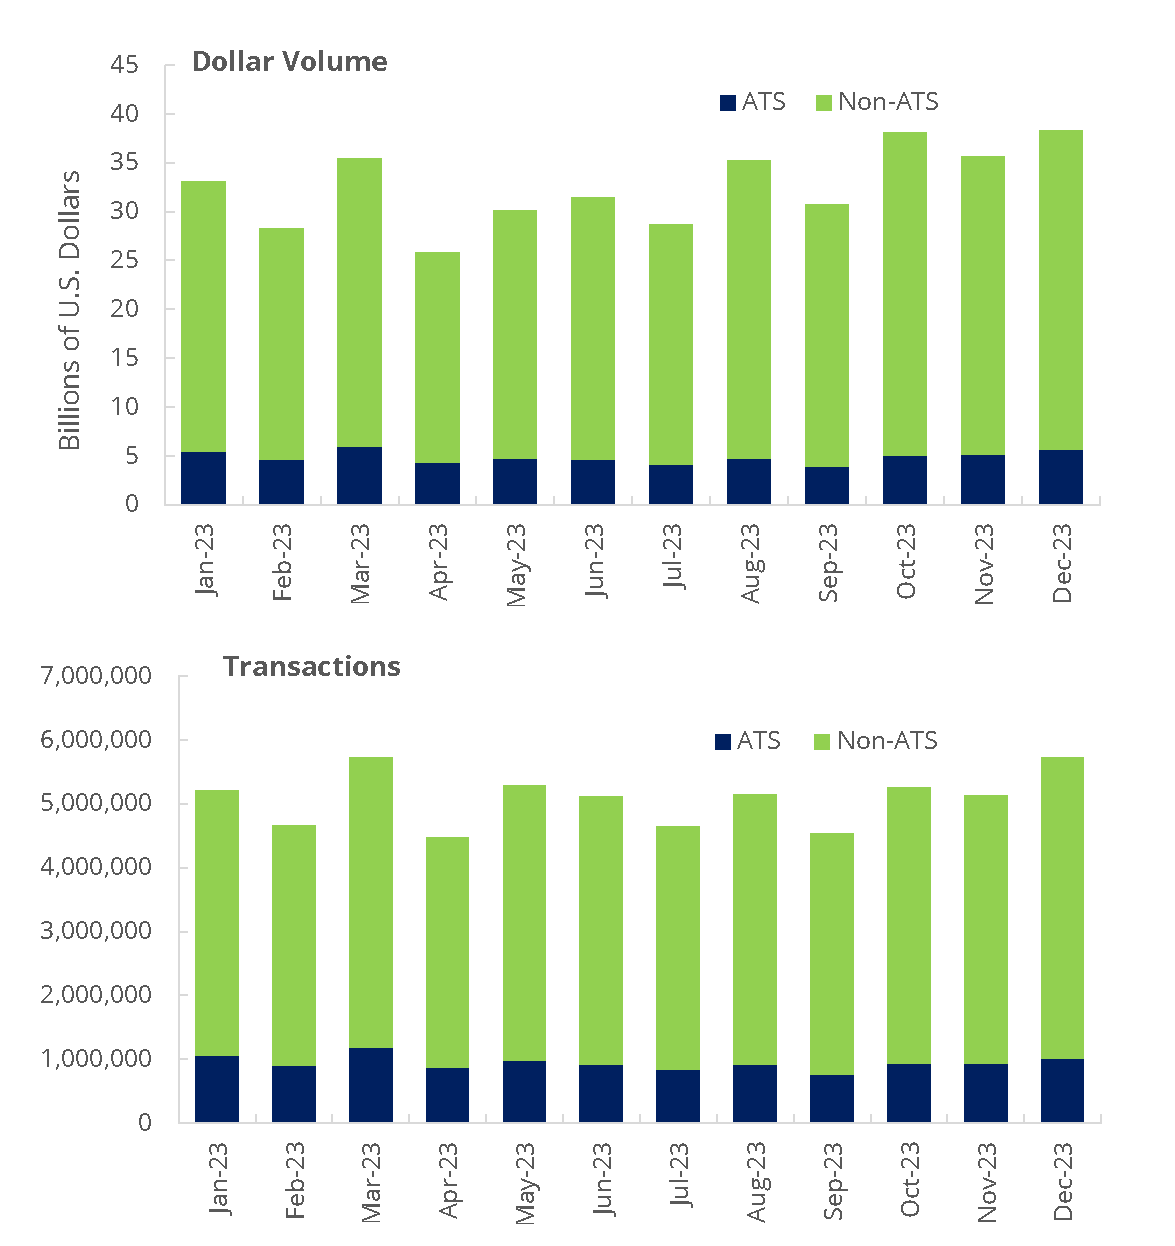
Source: Financial Industry Regulatory Authority. Data as of February 2024.
1Data is based on trading activity reported to CAT and processed by FINRA.
3.1.3 Market Activity for Equities Traded by Listing Status
Figure 3.1.3.1 Monthly Dollar Volume of Equities Traded (ADR vs. Non-ADR) by Listing Status, 20231
(In billions of U.S. dollars)
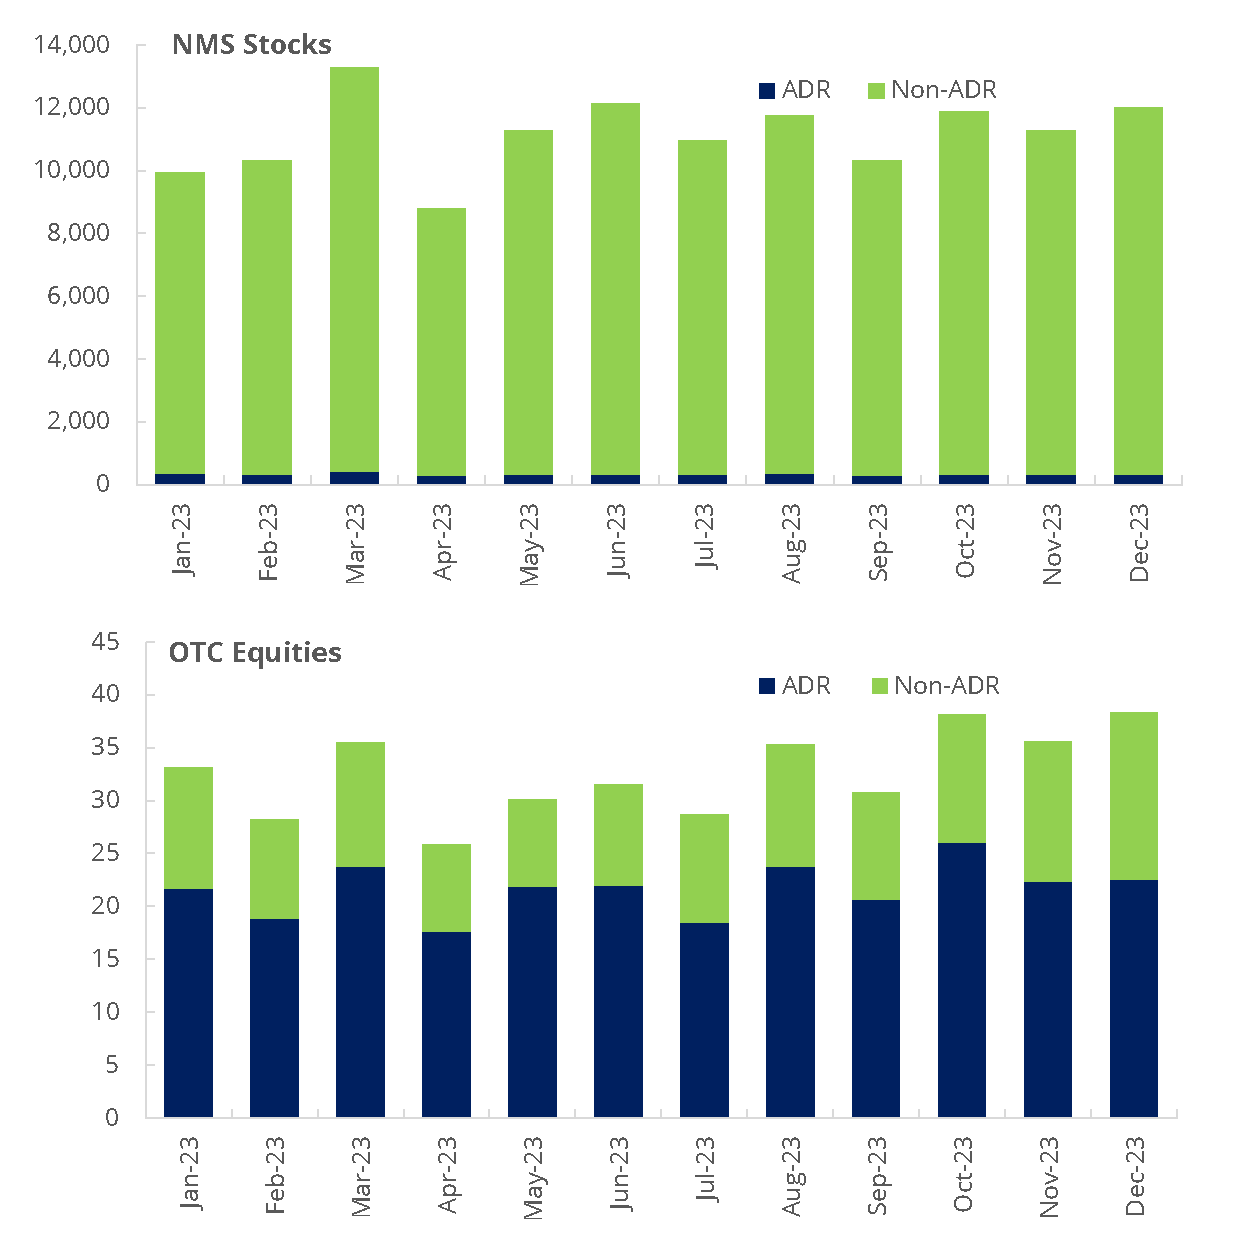
Source: Financial Industry Regulatory Authority. Data as of February 2024.
1Data is based on trading activity reported to CAT and processed by FINRA.
3.2 Options Activity
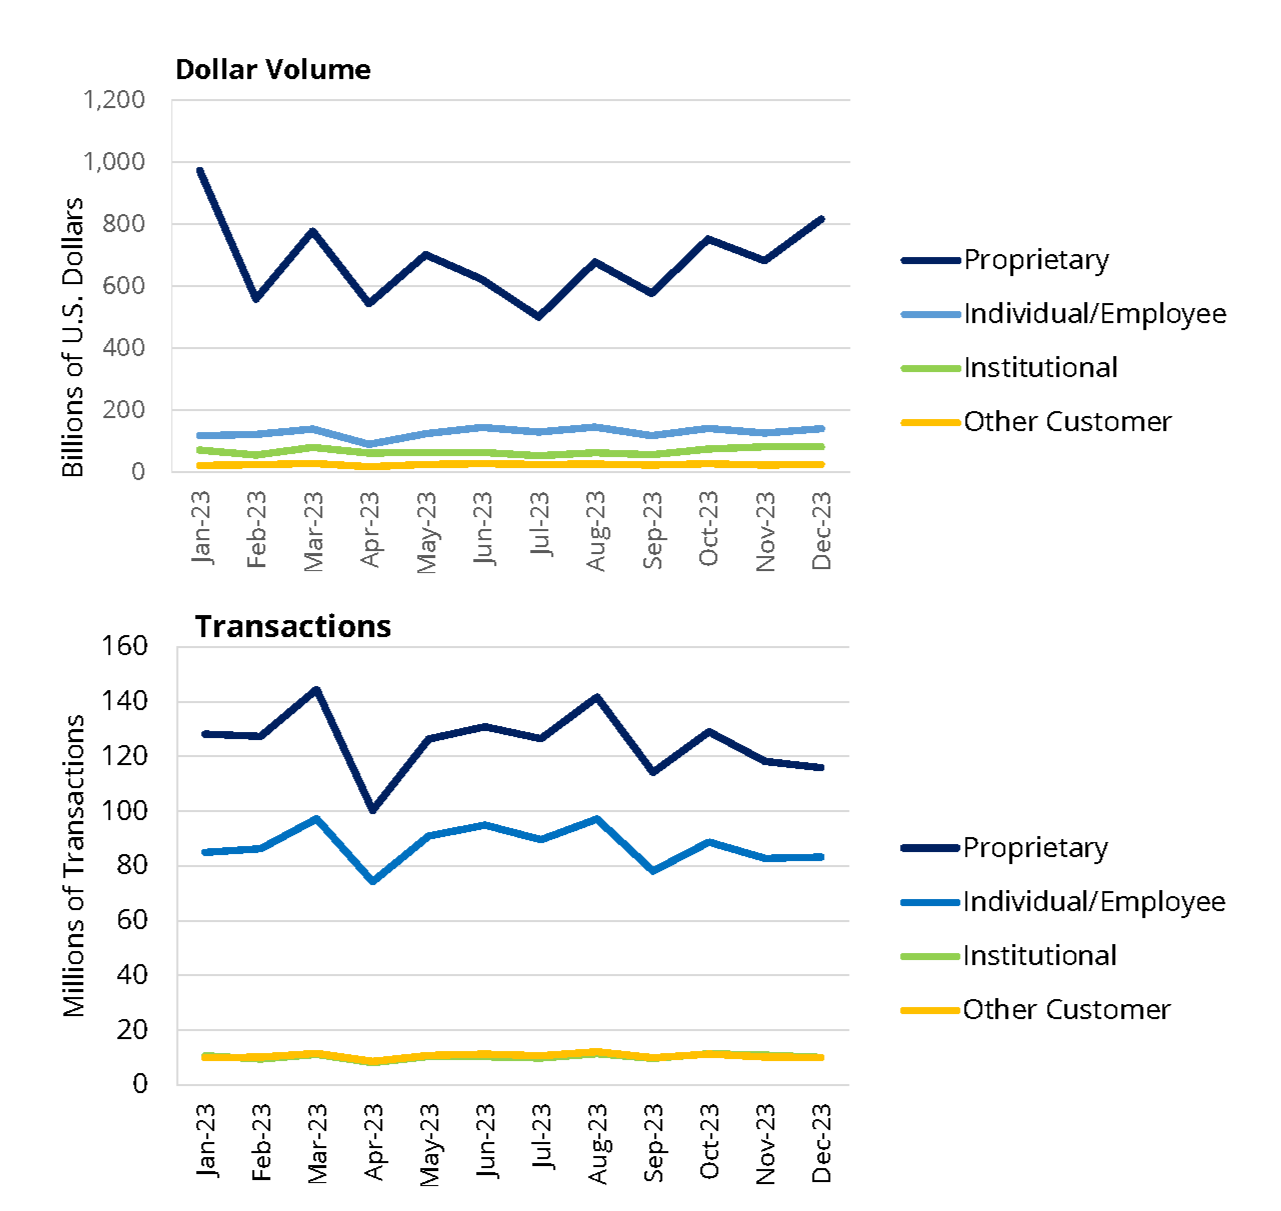
Figure 3.2.1 Options Trading Activity By Originating Account Owner Type, 20231
Source: Financial Industry Regulatory Authority. Data as of February 2024.
1Data is based on trading activity reported to CAT and processed by FINRA. Includes trades but not orders or quotations. Account Owner Type follows the "accountHolderType" categories in the CAT Reporting Technical Specifications for Industry Members. "Proprietary" activity is made up of the other proprietary, market making and error account categories as well as trades that do not have an explicit account owner type value (these are presumed to be market making trades). "Other Customer" includes the foreign and firm agency average price account categories.
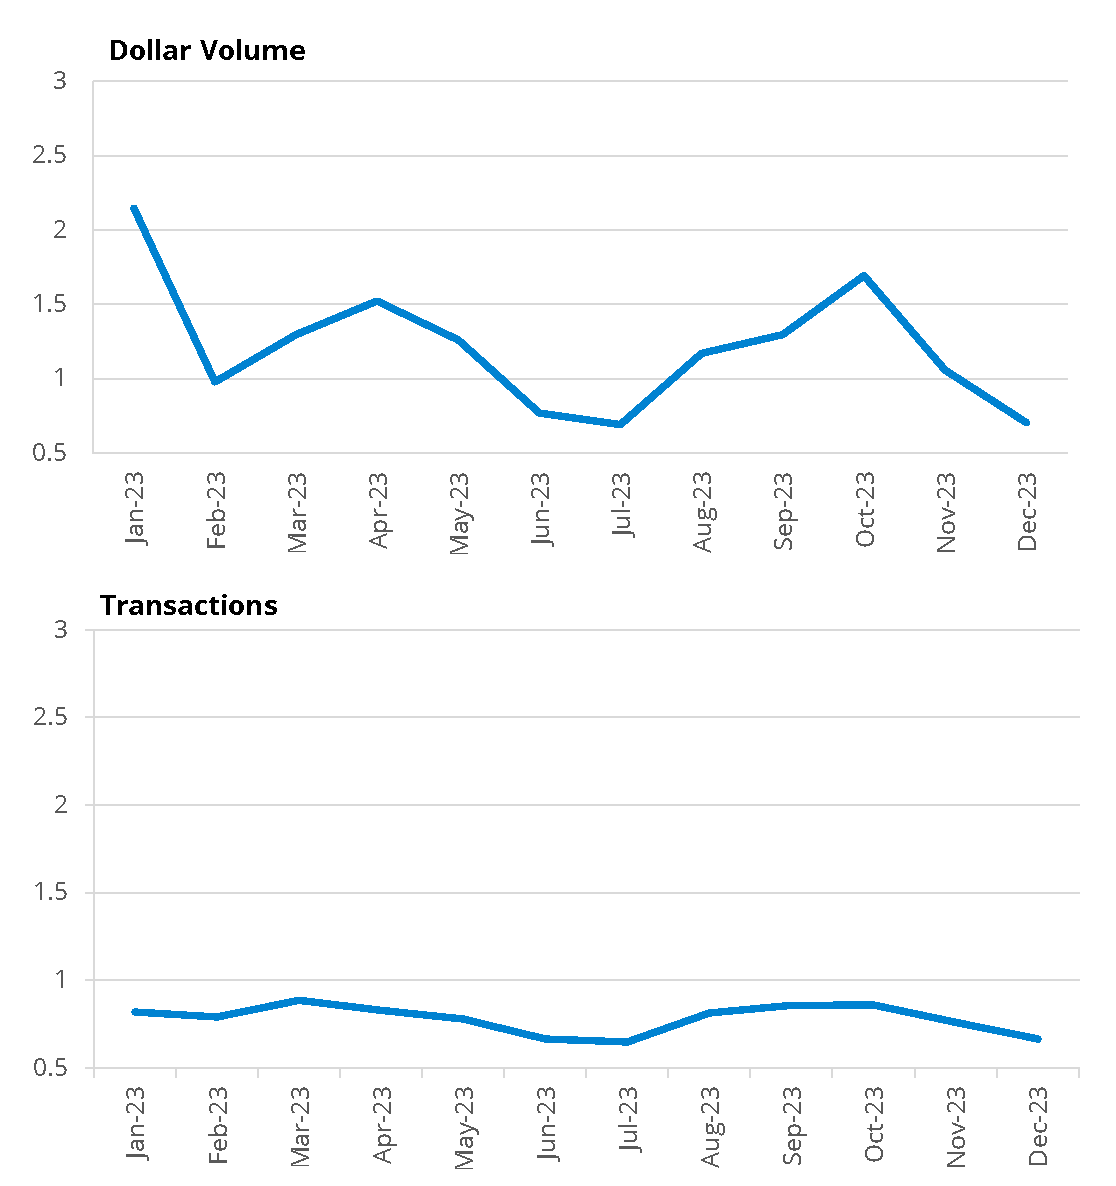
Figure 3.2.2 Put/Call Ratio by Volume and Transaction Count, 20231
Source: Financial Industry Regulatory Authority. Data as of February 2024.
1Data is based on trading activity reported to CAT and processed by FINRA. The Put/Call ratio is defined as the monthly sum of puts divided by the monthly sum of calls in either measurement mode.
3.3 Fixed Income Activity
Table 3.3.1 TRACE Reported Fixed Income Activity by Product Type and Venue Type, 2020−20231
Corporate and Agency | 2020 | 2021 | 2022 | 2023 | |
|---|---|---|---|---|---|
Avg. Daily Transactions | Alternative Trading Systems | 12,427 | 11,724 | 18,241 | 23,555 |
| Non-Alternative Trading Systems | 57,560 | 55,599 | 76,936 | 92,773 | |
| Total | 69,987 | 67,323 | 95,177 | 116,328 | |
Avg. Daily Volume (in $ billions) | Alternative Trading Systems | 2.9 | 3.6 | 2.7 | 3.3 |
| Non-Alternative Trading Systems | 43.4 | 38.8 | 40.3 | 43.5 | |
| Total | 46.4 | 42.4 | 43.1 | 46.8 | |
Securitized Products | 2020 | 2021 | 2022 | 2023 | |
|---|---|---|---|---|---|
Avg. Daily Transactions | Alternative Trading Systems | 3,960 | 3,267 | 3,251 | 2,937 |
| Non-Alternative Trading Systems | 9,784 | 10,175 | 11,472 | 12,170 | |
| Total | 13,744 | 13,443 | 14,724 | 15,107 | |
Avg. Daily Volume (in $ billions) | Alternative Trading Systems | 67.9 | 60.7 | 59.3 | 58.8 |
| Non-Alternative Trading Systems | 247.0 | 240.9 | 199.6 | 213.6 | |
| Total | 314.9 | 301.6 | 258.8 | 272.4 | |
Source: Financial Industry Regulatory Authority. Data as of February 2024.
1The Trade Reporting and Compliance Engine (TRACE) facilitates the mandatory reporting of over-the-counter secondary market transactions in eligible fixed income securities.
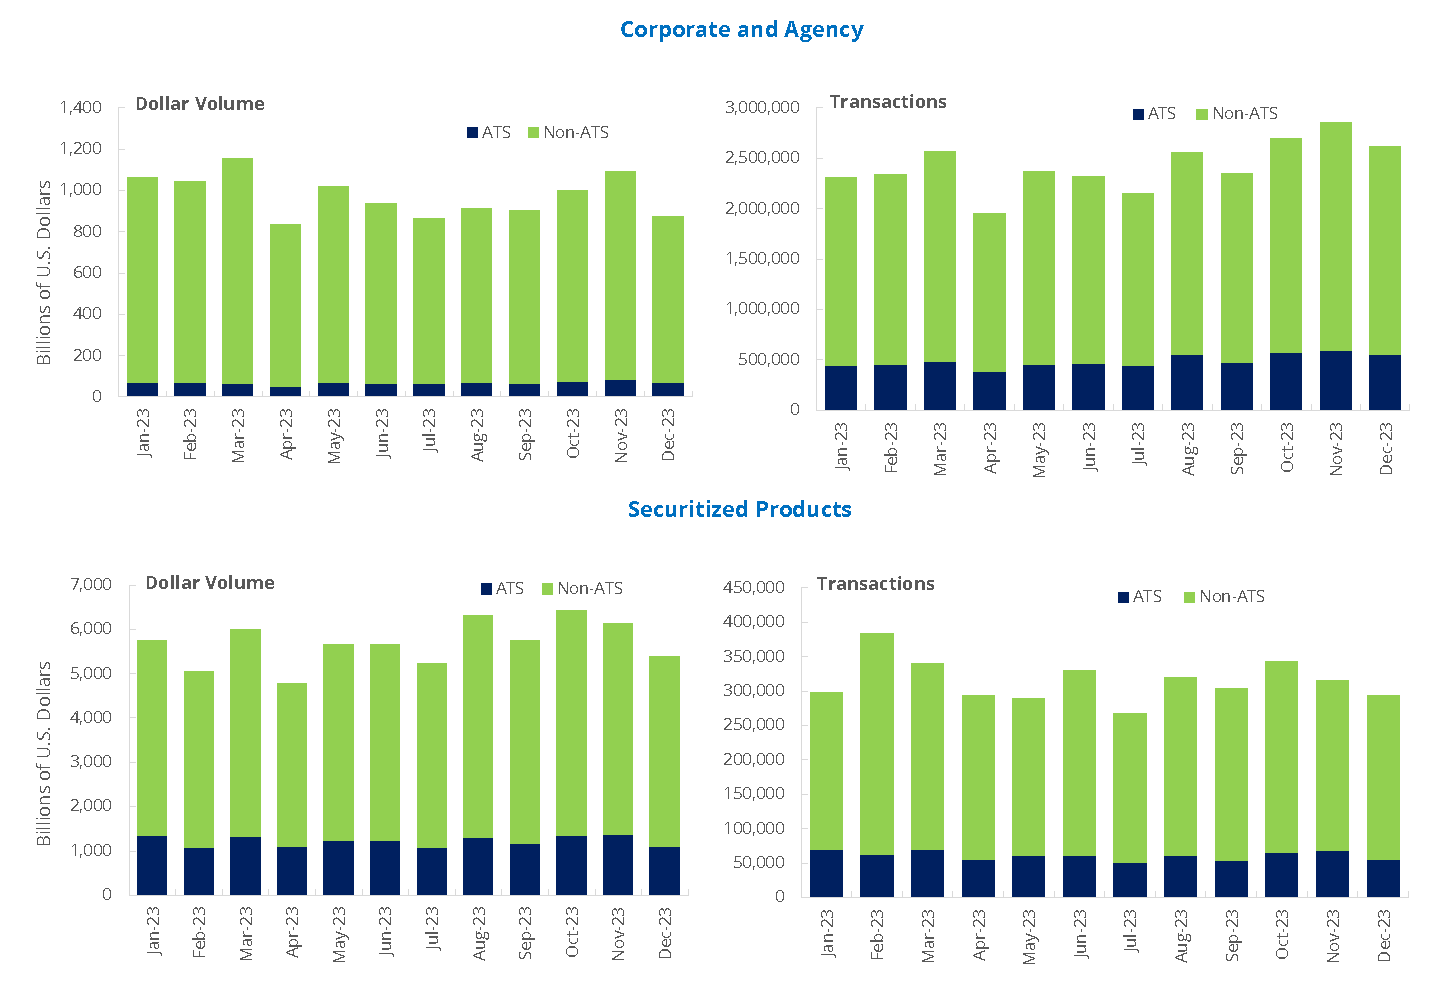
Figure 3.3.2 Monthly TRACE Reported Fixed Income Activity By Product Type and Venue Type, 20231
Source: Financial Industry Regulatory Authority. Data as of February 2024.
1The Trade Reporting and Compliance Engine (TRACE) facilitates the mandatory reporting of over-the-counter secondary market transactions in eligible fixed income securities.
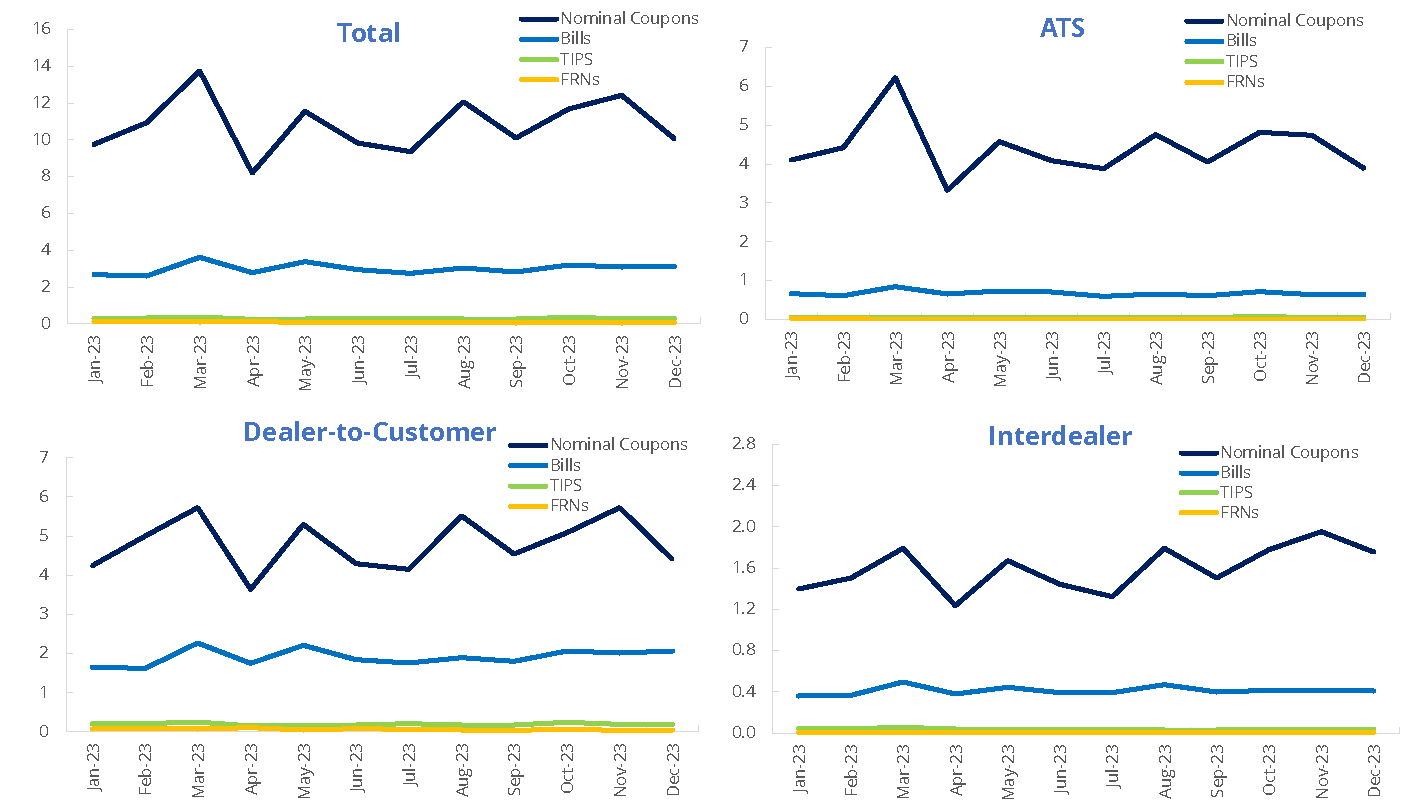
Figure 3.3.3 Monthly U.S. Treasuries Dollar Volumes by Participant-to-Trade Type and Product Type, 20231,2
(In trillions of U.S. dollars)
Source: Financial Industry Regulatory Authority. Data as of February 2024.
1The "ATS" and "Interdealer" categories include the sell side of a trade when, respectively, (1) a trade is executed on an ATS (including ATS sales to non-members or non-member affiliates) or (2) a trade is executed between FINRA members outside of an ATS (i.e. dealer-to-dealer trades). These categories exclude a FINRA member sell to an ATS. This approach takes into account multiple reporting of trades where a trade involves an ATS or both sides are FINRA members.
2The "Dealer-to-Customer" category includes all trades (buys and sells) reported by a FINRA member against non-members or non-member affiliates. The category excludes ATS transactions with non-members and non-member affiliates (those trades are represented in the "ATS" category as noted above).
Figure 3.3.4 U.S. Treasuries Dollar Volumes by Product Type and Participant-to-Trade Type, 20231,2
(In percentage of product type)
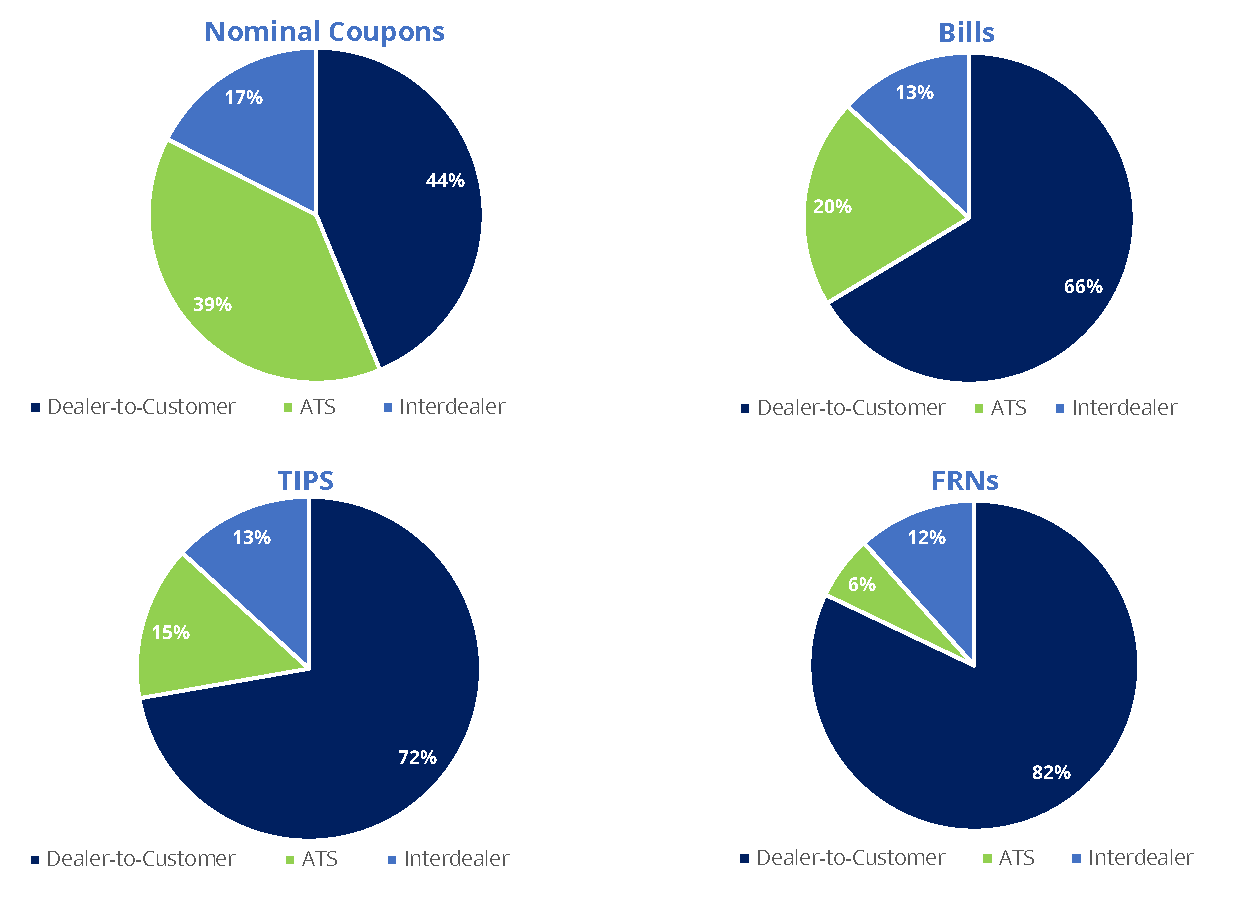
Source: Financial Industry Regulatory Authority. Data as of February 2024.
1The "ATS" and "Interdealer" categories include the sell side of a trade when, respectively, (1) a trade is executed on an ATS (including ATS sales to non-members or non-member affiliates) or (2) a trade is executed between FINRA members outside of an ATS (i.e. dealer-to-dealer trades). These categories exclude a FINRA member sell to an ATS. This approach takes into account multiple reporting of trades where a trade involves an ATS or both sides are FINRA members.
2The "Dealer-to-Customer" category includes all trades (buys and sells) reported by a FINRA member against non-members or non-member affiliates. The category excludes ATS transactions with non-members and non-member affiliates (those trades are represented in the "ATS" category as noted above).
3.4 Customer Margin
Figure 3.4.1 FINRA-Registered Firms – Customer Margin Balances, 2019−20231
(In millions of U.S. dollars as of year-end)
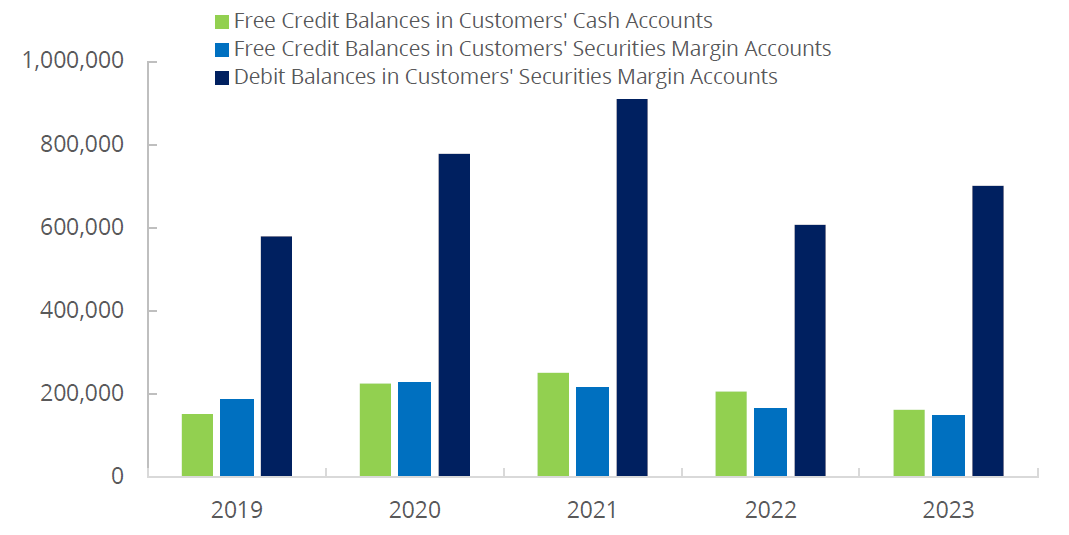
Source: Customer Balance Summary Forms.
1Pursuant to FINRA Rule 4521(d), FINRA member firms carrying margin accounts for customers are required to submit, on a settlement date basis, as of the last business day of the month, the following customer information: (i) the total of all debit balances in securities margin accounts; and (ii) the total of all free credit balances in all cash accounts and all securities margin accounts.