FINRA-Registered Firms
Table of Contents
- Figure 2.1.1 Total Number of FINRA-Registered Firms, 2019−2023
- Figure 2.1.2 Firm Distribution by Size, 2019−2023
- Table 2.1.3 Firm Distribution by Size, 2019−2023
- Figure 2.1.4 Securities Industry Registered Firms by Type of Registration, 2014−2023
- Table 2.1.5 Securities Industry Registered Firms by Type of Registration, 2014−2023
- Figure 2.1.6 Distribution of Branches by Firm Size, 2019−2023
- Table 2.1.7 Distribution of Branches by Firm Size, 2019−2023
- Figure 2.1.8 Firm Distribution by Specified Demographics, 2023
- Table 2.1.9 Firm Distribution by Number of Registered Representatives: Additional Breakdown, 2019–2023
- Figure 2.1.10 Change in Number of FINRA-Registered Firms, 2013, 2018, 2023
2.2 Entrance and Exit of Firms- Figure 2.2.1 FINRA-Registered Firms – Median Number of Years in Business, 2013, 2018, 2023
- Figure 2.2.2 FINRA-Registered Firms – Leaving/Entering FINRA Membership, 2009–2023
- Table 2.2.3 FINRA-Registered Firms – Leaving/Entering FINRA Membership, 2009–2023
- Figure 2.2.4 FINRA-Registered Firm Branch Offices – Opening/Closing, 2013–2023
- Table 2.2.5 FINRA-Registered Firm Branch Offices – Opening/Closing, 2013–2023
- Figure 2.3.1 Geographic Distribution of Firms by Number of Branches, 2023
- Table 2.3.2 Branches By State/Region, 2019–2023
- Figure 2.3.3 Geographic Distribution of Firms by Headquarters, 2023
- Table 2.3.4 Geographic Distribution of Firms by Headquarters, 2019–2023
- Figure 2.3.5 Urban-Rural Breakdown of FINRA-Registered Firms and Branches by Firm Size—2023
- Table 2.3.6 Urban-Rural Breakdown of FINRA-Registered Firms and Branches by Firm Size—2023
- Figure 2.4.1 Advertising Regulation Filing Volumes, 2019–2023
- Table 2.4.2 FINRA-Registered Firms – Most Common Marketing Methods Filed with FINRA, 2023
- Figure 2.4.3 Advertising Regulation Filing Volumes – Investment Company Product, 2023
- Table 2.4.4 Advertising Regulation Filing Volumes – Investment Company Product, 2023
- Table 2.4.5 Advertising Regulation Filing Volumes – Voluntary vs. Mandatory, 2019–2023
- Figure 2.5.1 Capital Acquisition Brokers and Funding Portals, 2019–2023
- Table 2.5.2 Total Number of Unique Corporate Financing Filings, 2019–2023
- Table 2.6.1 Small Firms – Business Segments as of December 2023
- Table 2.6.2 Mid-Size Firms – Business Segments as of December 2023
- Table 2.6.3 Large Firms – Business Segments as of December 2023
- Figure 2.7.1 Excess Net Capital By Firm Size, 2019-2023
- Figure 2.7.2 FINRA-Registered Firms – Total Revenues and Expenses, 2019−2023
- Table 2.7.3 FINRA-Registered Firms – Aggregate Financial Information, 2019–2023
2.1 Sizes and Counts
Figure 2.1.1 Total Number of FINRA-Registered Firms, 2019−20231
(Counts as of year-end)
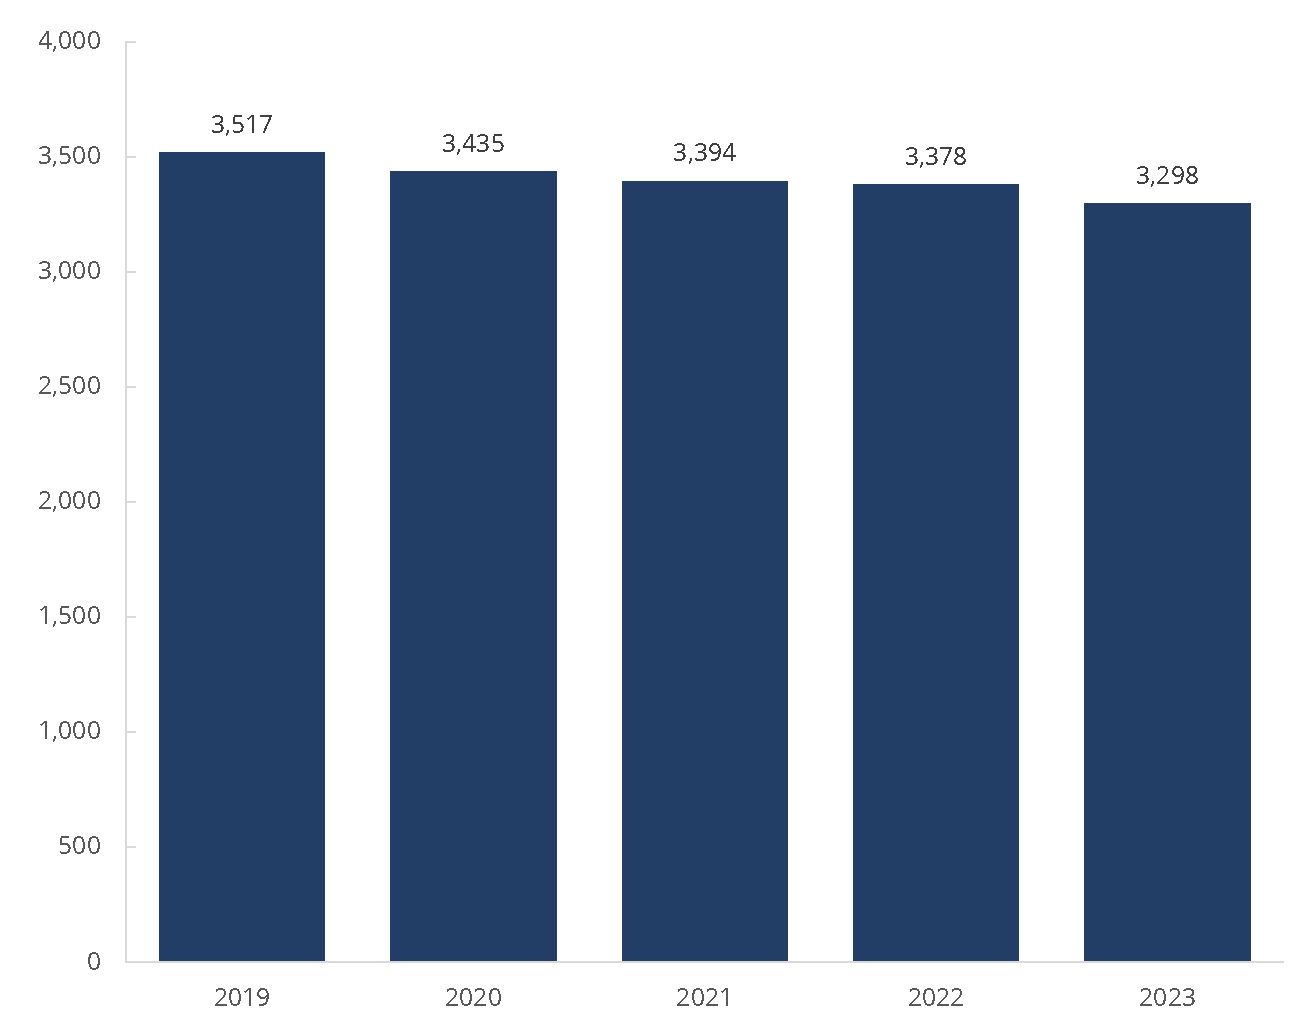
Source: Financial Industry Regulatory Authority.
1Most firms conducting securities transactions and business with the investing public must be registered with a national securities association like FINRA. Firms must meet certain membership standards to attain and maintain registration.
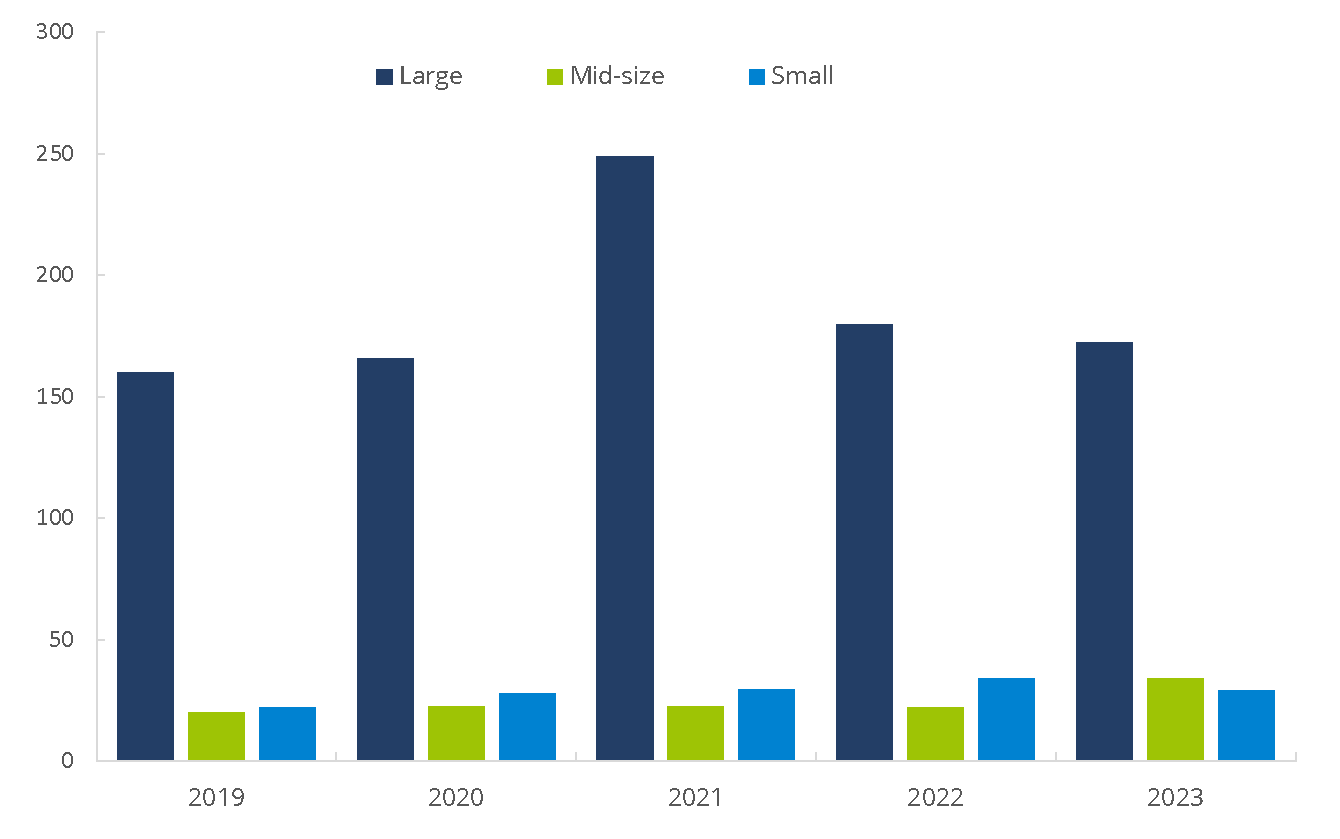
Figure 2.1.2 Firm Distribution by Size, 2019−20231
(Counts as of year-end)
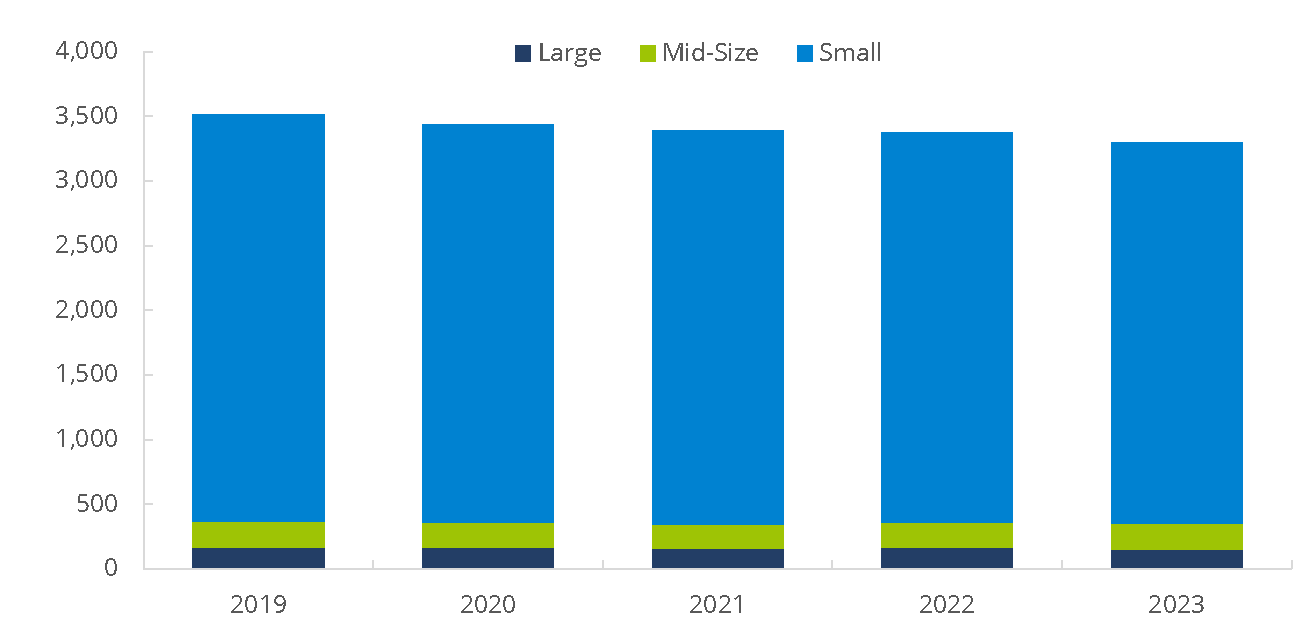
Source: Financial Industry Regulatory Authority.
1Large Firm = 500 or more registered representatives; Mid-Size Firm = 151-499 registered representatives; Small Firm = 1-150 registered representatives.
Table 2.1.3 Firm Distribution by Size, 2019−20231
(Counts as of year-end)
2019 | 2020 | 2021 | 2022 | 2023 | |
|---|---|---|---|---|---|
| Large | 168 | 165 | 161 | 165 | 155 |
| Mid-Size | 198 | 191 | 185 | 192 | 198 |
| Small | 3,151 | 3,079 | 3,048 | 3,021 | 2,945 |
| Total | 3,517 | 3,435 | 3,394 | 3,378 | 3,298 |
Source: Financial Industry Regulatory Authority.
1Large Firm = 500 or more registered representatives; Mid-Size Firm = 151-499 registered representatives; Small Firm = 1-150 registered representatives.
Figure 2.1.4 Securities Industry Registered Firms by Type of Registration, 2014−20231
(Counts as of year-end)
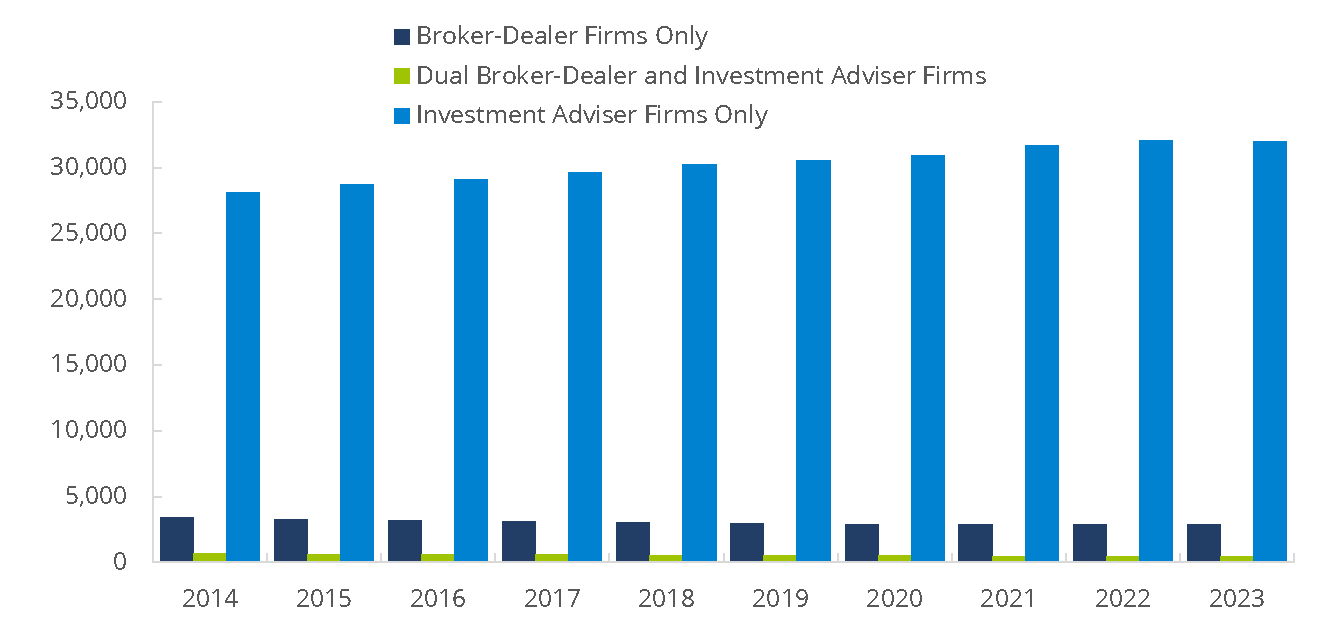
Source: Financial Industry Regulatory Authority.
1"Broker-Dealer Firms Only" refers to firms that are solely registered with FINRA as broker-dealers. "Dual Broker-Dealer and Investment Adviser Firms" refers to FINRA-registered broker-dealers that are also registered as investment adviser firms. "Investment Adviser Firms Only" refers to firms that are registered only as investment advisers and are overseen by the SEC or state regulators. "Securities Industry Registered Firms" refers to the totality of registered firms.
Table 2.1.5 Securities Industry Registered Firms by Type of Registration, 2014−20231
(Counts as of year-end)
2014 | 2015 | 2016 | 2017 | 2018 | 2019 | 2020 | 2021 | 2022 | 2023 | |
|---|---|---|---|---|---|---|---|---|---|---|
| Broker-Dealer Firms Only | 3,391 | 3,303 | 3,226 | 3,130 | 3,045 | 2,989 | 2,930 | 2,914 | 2,915 | 2,867 |
| Dual Broker-Dealer and Investment Adviser Firms | 677 | 640 | 609 | 596 | 562 | 528 | 505 | 480 | 463 | 431 |
| All FINRA-Registered Broker-Dealer Firms | 4,068 | 3,943 | 3,835 | 3,726 | 3,607 | 3,517 | 3,435 | 3,394 | 3,378 | 3,298 |
| Investment Adviser Firms Only | 28,135 | 28,712 | 29,081 | 29,600 | 30,246 | 30,535 | 30,891 | 31,669 | 32,021 | 31,971 |
| Total Registered Firms | 32,203 | 32,655 | 32,916 | 33,326 | 33,853 | 34,052 | 34,326 | 35,063 | 35,399 | 35,269 |
Source: Financial Industry Regulatory Authority.
1"Broker-Dealer Firms Only" refers to firms that are solely registered with FINRA as broker-dealers. "Dual Broker-Dealer and Investment Adviser Firms" refers to FINRA-registered broker-dealers that are also registered as investment adviser firms. "Investment Adviser Firms Only" refers to firms that are registered only as investment advisers and are overseen by the SEC or state regulators. "Securities Industry Registered Firms" refers to the totality of registered firms.
Figure 2.1.6 Distribution of Branches by Firm Size, 2019−20231,2,3
(Counts as of year-end)
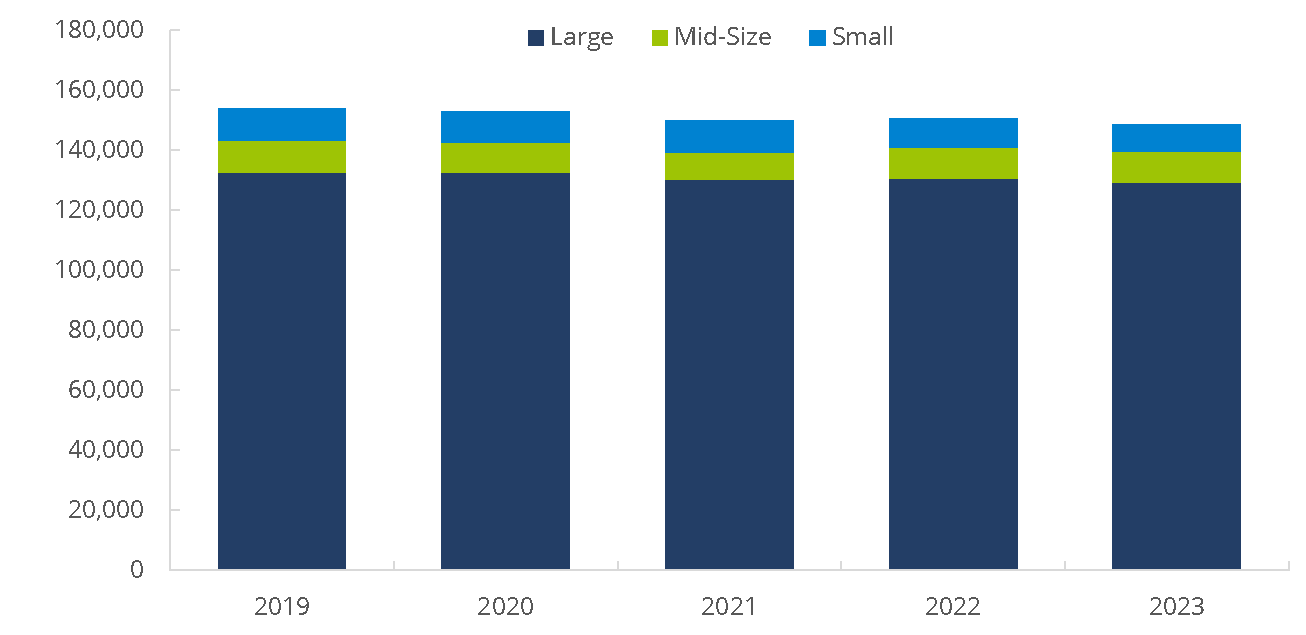
Source: Financial Industry Regulatory Authority.
1For each branch office, a FINRA-registered firm must file a Form BR (the Uniform Branch Office Registration Form).
2Rule 3110(f) defines a branch office and non-branch location (or unregistered location). Under Rule 3110(f)(2)(A), a "branch office" is any location where one or more associated persons of a member conducts the business of effecting any transaction in, or inducing or attempting to induce the purchase or sale of any security or is held out as such. A branch office may be an office of supervisory jurisdiction (OSJ) if any one of the activities set forth under Rule 3110(f)(1) occurs at the location, or a supervisory branch office as set forth under Rule 3110(f)(2)(B).
3Large Firm = 500 or more registered representatives; Mid-Size Firm = 151-499 registered representatives; Small Firm = 1-150 registered representatives.
Table 2.1.7 Distribution of Branches by Firm Size, 2019−20231,2,3
(Counts as of year-end)
2019 | 2020 | 2021 | 2022 | 2023 | |
|---|---|---|---|---|---|
| Large | 132,758 | 132,719 | 130,295 | 130,674 | 129,281 |
| Mid-Size | 10,660 | 9,766 | 9,074 | 10,299 | 10,318 |
| Small | 10,489 | 10,376 | 10,518 | 9,674 | 9,119 |
| Total | 153,907 | 152,861 | 149,887 | 150,647 | 148,718 |
Source: Financial Industry Regulatory Authority.
1For each branch office, a FINRA-registered firm must file a Form BR (the Uniform Branch Office Registration Form).
2Rule 3110(f) defines a branch office and non-branch location (or unregistered location). Under Rule 3110(f)(2)(A), a "branch office" is any location where one or more associated persons of a member conducts the business of effecting any transaction in, or inducing or attempting to induce the purchase or sale of any security or is held out as such. A branch office may be an office of supervisory jurisdiction (OSJ) if any one of the activities set forth under Rule 3110(f)(1) occurs at the location, or a supervisory branch office as set forth under Rule 3110(f)(2)(B).
3Large Firm = 500 or more registered representatives; Mid-Size Firm = 151-499 registered representatives; Small Firm = 1-150 registered representatives.
Figure 2.1.8 Firm Distribution by Specified Demographics, 2023
(Percentage of total as of year-end)
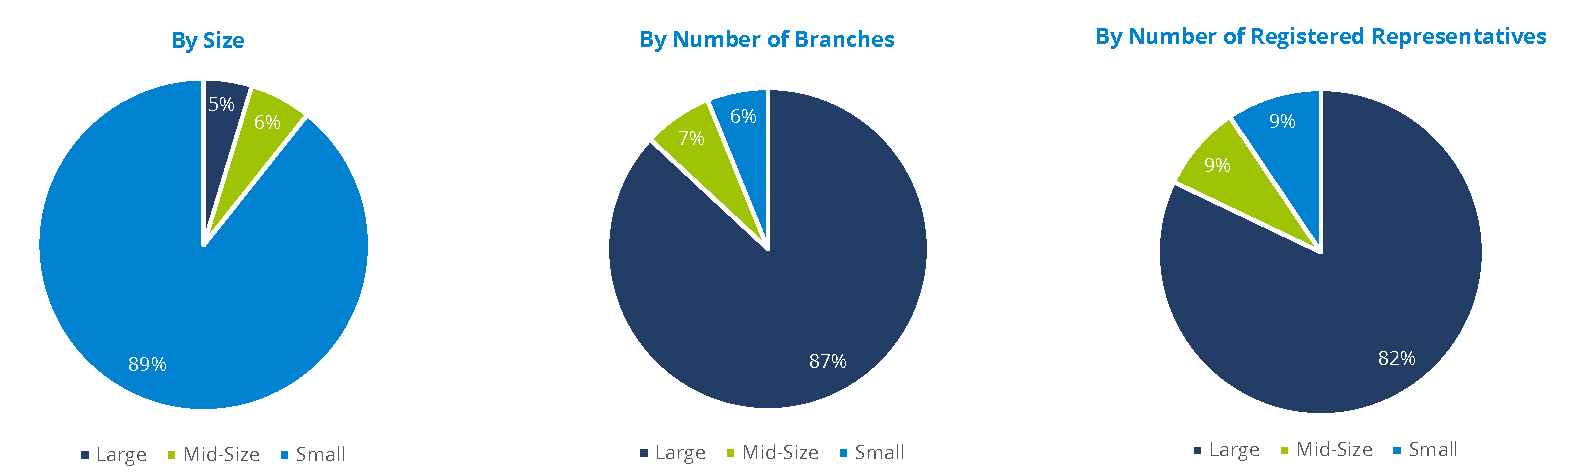
Source: Financial Industry Regulatory Authority.
Table 2.1.9 Firm Distribution by Number of Registered Representatives: Additional Breakdown, 2019–2023
(Counts as of year-end)
Number of Registered Representatives | 2019 | 2020 | 2021 | 2022 | 2023 |
|---|---|---|---|---|---|
>1000 | 95 | 93 | 90 | 91 | 88 |
500-1000 | 73 | 72 | 71 | 74 | 67 |
301-499 | 69 | 66 | 63 | 66 | 71 |
151-300 | 129 | 125 | 122 | 126 | 127 |
101-150 | 107 | 112 | 124 | 102 | 107 |
76-100 | 83 | 78 | 75 | 90 | 72 |
51-75 | 157 | 174 | 174 | 158 | 156 |
41-50 | 100 | 102 | 109 | 99 | 91 |
31-40 | 159 | 133 | 140 | 142 | 157 |
26-30 | 114 | 119 | 110 | 102 | 99 |
21-25 | 164 | 124 | 133 | 156 | 152 |
16-20 | 236 | 248 | 224 | 200 | 215 |
11-15 | 370 | 374 | 365 | 361 | 344 |
10 or Fewer | 1,661 | 1,615 | 1,594 | 1,611 | 1,552 |
Total | 3,517 | 3,435 | 3,394 | 3,378 | 3,298 |
Source: Financial Industry Regulatory Authority.
Figure 2.1.10 Change in Number of FINRA-Registered Firms, 2013, 2018, 2023
(Counts as of year-end)
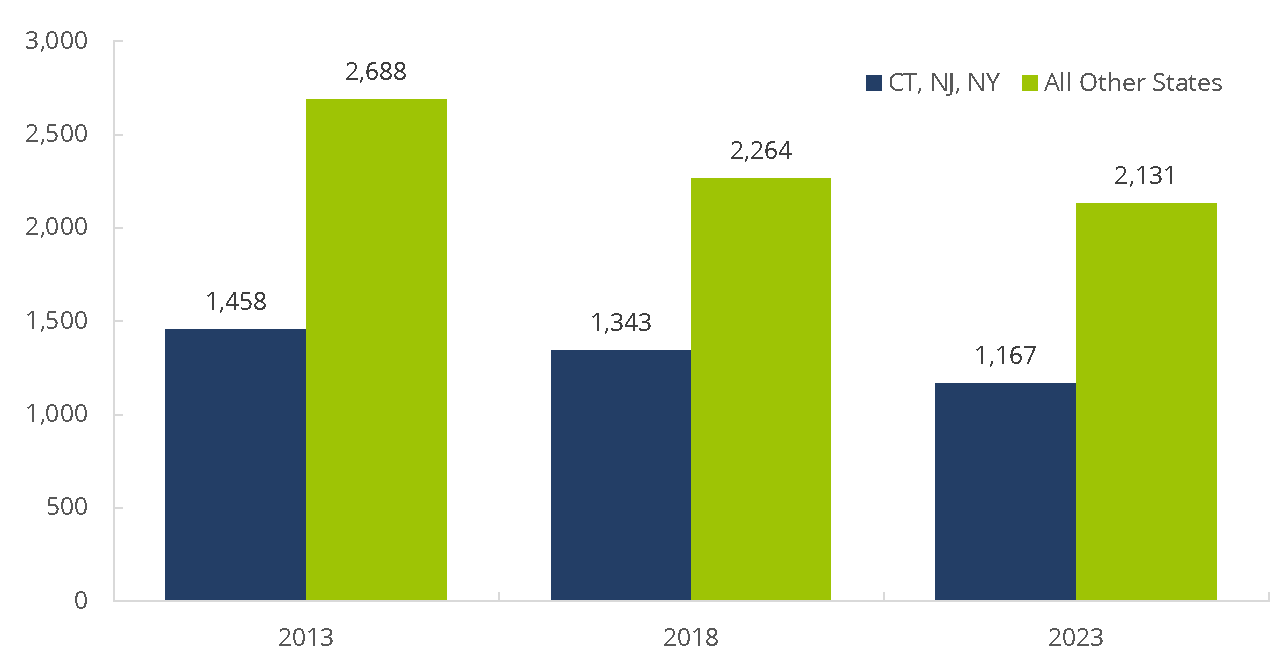
Source: Financial Industry Regulatory Authority.
2.2 Entrance and Exit of Firms
Figure 2.2.1 FINRA-Registered Firms – Median Number of Years in Business, 2013, 2018, 2023
(As of year-end)
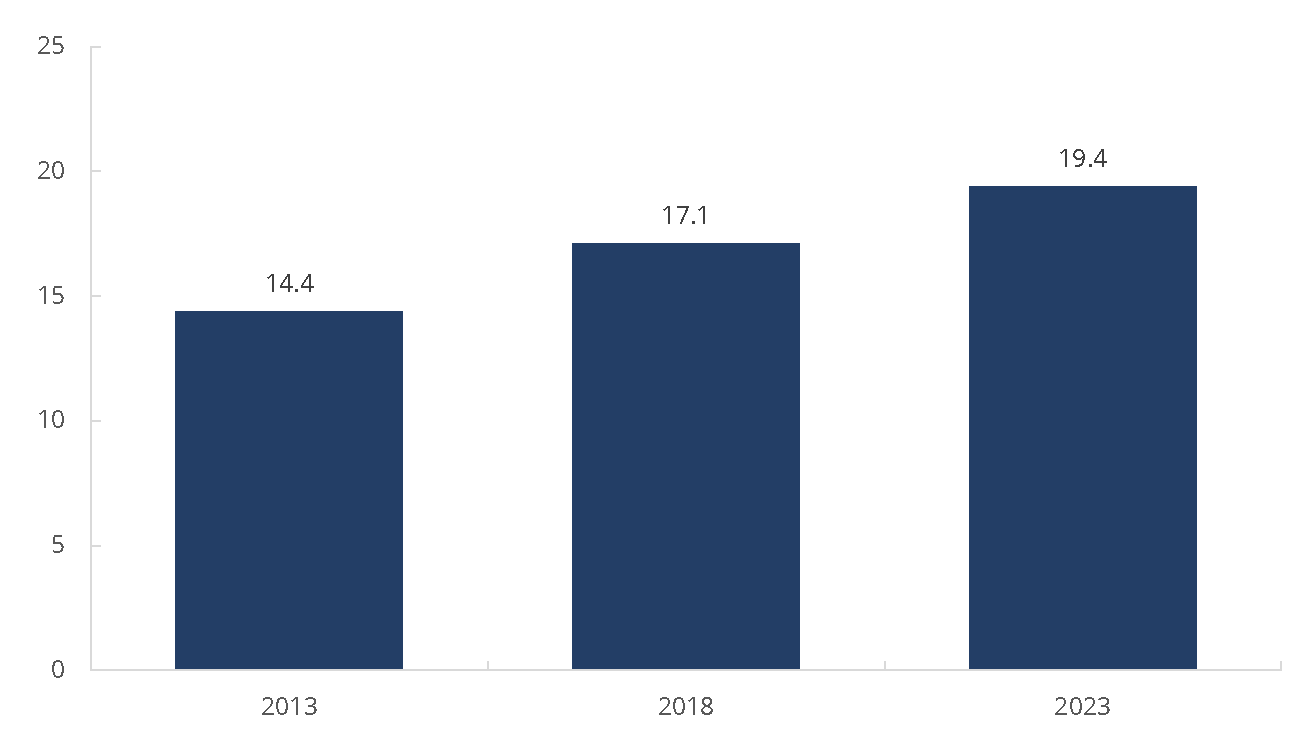
Source: Financial Industry Regulatory Authority.
Figure 2.2.2 FINRA-Registered Firms – Leaving/Entering FINRA Membership, 2009–2023
(Counts as of year-end)
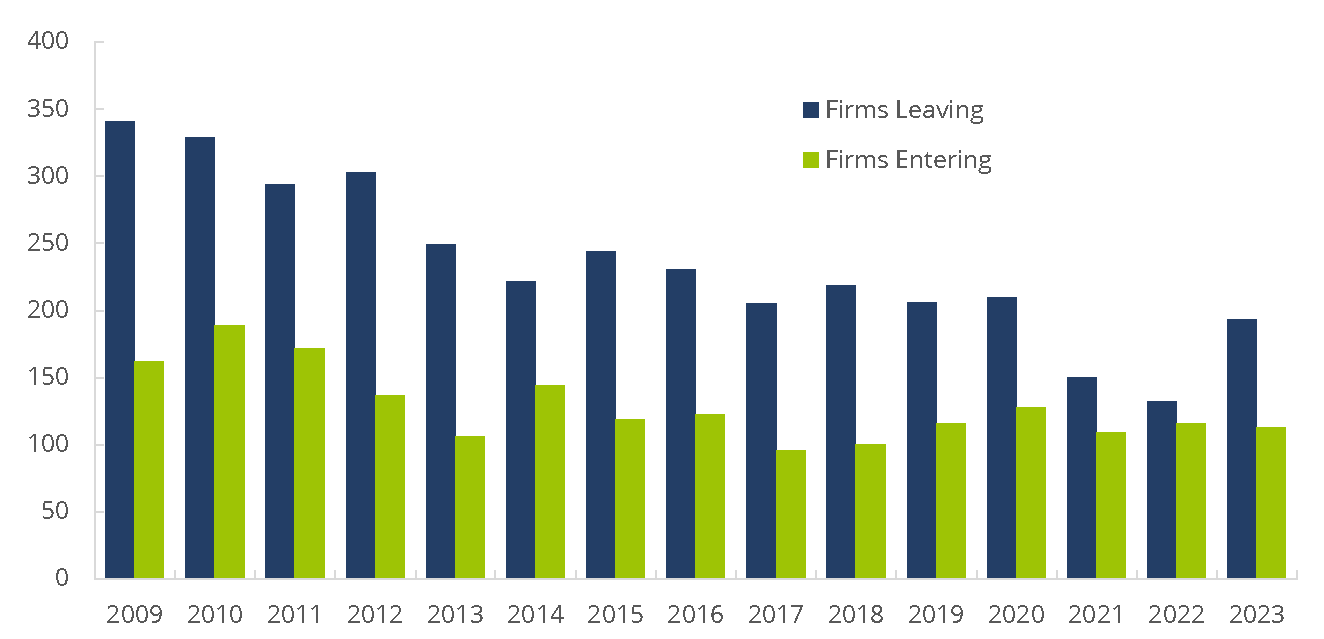
Source: Financial Industry Regulatory Authority.
Table 2.2.3 FINRA-Registered Firms – Leaving/Entering FINRA Membership, 2009–2023
(Counts as of year-end)
Year | Firms | % of Total | Firms | % of Total | End-of-Year Total |
|---|---|---|---|---|---|
2009 | 341 | 7% | 162 | 3% | 4,717 |
2010 | 329 | 7% | 189 | 4% | 4,577 |
2011 | 294 | 7% | 172 | 4% | 4,455 |
2012 | 303 | 7% | 137 | 3% | 4,289 |
2013 | 249 | 6% | 106 | 3% | 4,146 |
2014 | 222 | 5% | 144 | 4% | 4,068 |
2015 | 244 | 6% | 119 | 3% | 3,943 |
2016 | 231 | 6% | 123 | 3% | 3,835 |
2017 | 205 | 6% | 96 | 3% | 3,726 |
2018 | 219 | 6% | 100 | 3% | 3,607 |
2019 | 206 | 6% | 116 | 3% | 3,517 |
2020 | 210 | 6% | 128 | 4% | 3,435 |
2021 | 150 | 4% | 109 | 3% | 3,394 |
2022 | 132 | 4% | 116 | 3% | 3,378 |
2023 | 193 | 6% | 113 | 3% | 3,298 |
Source: Financial and Operational Combined Uniform Single (FOCUS) Reports.
Figure 2.2.4 FINRA-Registered Firm Branch Offices – Opening/Closing, 2013–2023
(Counts as of year-end)
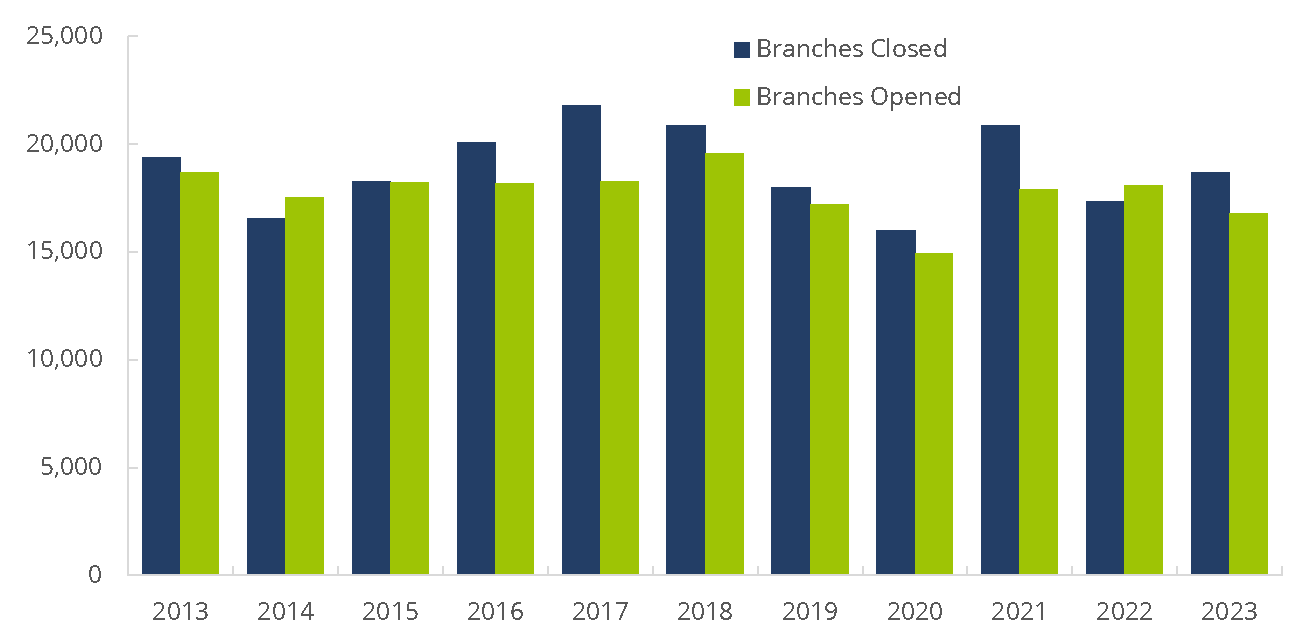
Source: Financial Industry Regulatory Authority.
Table 2.2.5 FINRA-Registered Firm Branch Offices – Opening/Closing, 2013–2023
(Counts as of year-end)
Year | Branches | % of Total | Branches | % of Total | End-of-Year Total |
|---|---|---|---|---|---|
2013 | 19,382 | 12% | 18,711 | 12% | 160,478 |
2014 | 16,554 | 10% | 17,522 | 11% | 161,446 |
2015 | 18,296 | 11% | 18,242 | 11% | 161,392 |
2016 | 20,103 | 13% | 18,175 | 11% | 159,464 |
2017 | 21,797 | 14% | 18,300 | 12% | 155,967 |
2018 | 20,875 | 13% | 19,569 | 13% | 154,661 |
2019 | 17,979 | 12% | 17,225 | 11% | 153,907 |
2020 | 15,987 | 10% | 14,941 | 10% | 152,861 |
2021 | 20,847 | 14% | 17,873 | 12% | 149,887 |
2022 | 17,334 | 12% | 18,094 | 12% | 150,647 |
2023 | 18,704 | 13% | 16,775 | 11% | 148,718 |
Source: Financial Industry Regulatory Authority.
2.3 Geographic Distribution
Figure 2.3.5 Urban-Rural Breakdown of FINRA-Registered Firms and Branches by Firm Size, 20231,2
(Percentage of total as of year-end)
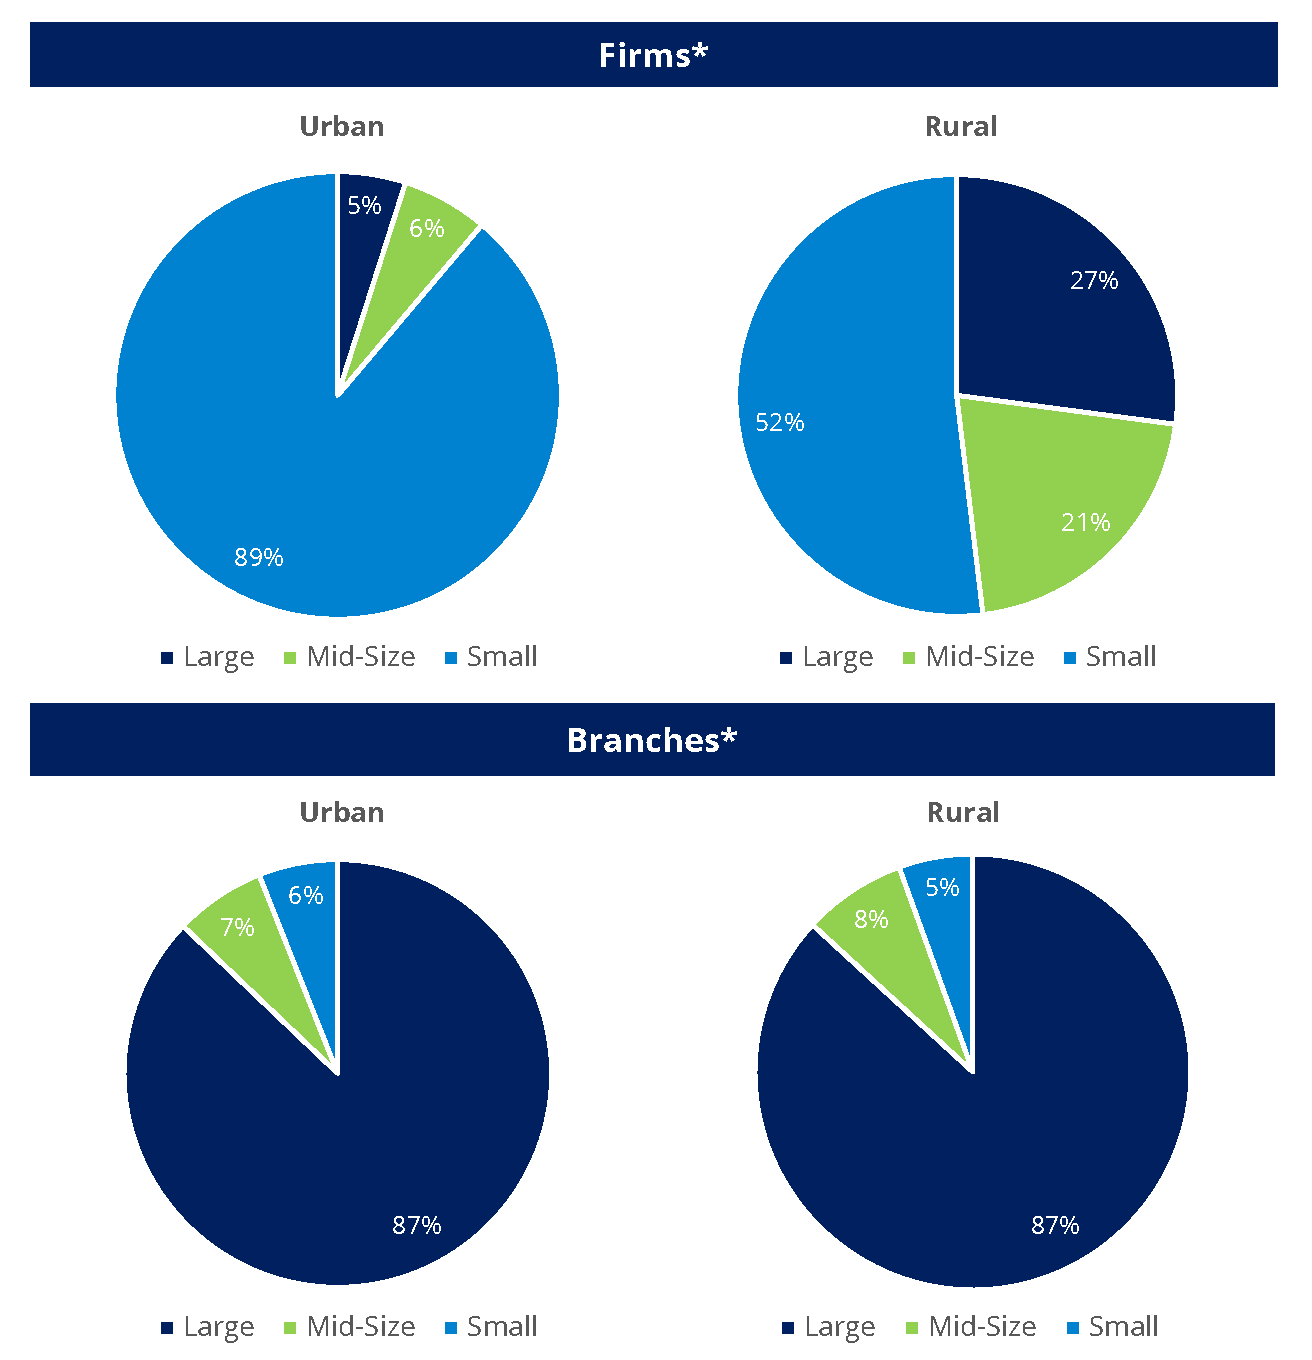
Source: U.S. Census Bureau; Financial Industry Regulatory Authority.
*A firm is counted if it has a branch in that area. Firms may be counted as both Urban and Rural depending on branch locations. Not included are firms and branches that do not report a zip code in CRD.
1Large Firm = 500 or more registered representatives; Mid-Size Firm = 151-400 registered representatives; Small Firm = 1-150 registered representatives.
2Branch and firm zip codes are linked to the 2010 Urban Area to Zip Code Tabulation Area (ZCTA) Relationship File. The Census Bureau identifies two types of urban areas: i) Urbanized Areas (UAs) of 50,000 or more people; ii) Urban Clusters (UCs) of at least 2,500 and less than 50,000 people. "Rural" encompasses all population, housing, and territory not included within an urban area.
Table 2.3.6 Urban-Rural Breakdown of FINRA-Registered Firms and Branches by Firm Size, 20231,2
| Firms* | Branches* | ||||||
|---|---|---|---|---|---|---|---|---|
| Urban | % Urban | Rural | % Rural | Urban | % Urban | Rural | % Rural |
Large | 154 | 5% | 107 | 27% | 125,071 | 87% | 4,123 | 87% |
Mid-Size | 196 | 6% | 83 | 21% | 9,860 | 7% | 365 | 8% |
Small | 2,783 | 89% | 205 | 52% | 8,628 | 6% | 261 | 5% |
Total | 3,133 | 100% | 395 | 100% | 143,559 | 100% | 4,749 | 100% |
Source: U.S. Census Bureau; Financial Industry Regulatory Authority.
*A firm is counted if it has a branch in that area. Firms may be counted as both Urban and Rural depending on branch locations. Not included are firms and branches that do not report a zip code in CRD.
1Large Firm = 500 or more registered representatives; Mid-Size Firm = 151-400 registered representatives; Small Firm = 1-150 registered representatives.
2Branch and firm zip codes are linked to the 2010 Urban Area to Zip Code Tabulation Area (ZCTA) Relationship File. The Census Bureau identifies two types of urban areas: i) Urbanized Areas (UAs) of 50,000 or more people; ii) Urban Clusters (UCs) of at least 2,500 and less than 50,000 people. "Rural" encompasses all population, housing, and territory not included within an urban area.
2.4 Advertising and Products
FINRA Rule 2210 governs member broker-dealers’ communications with the public, including communications with retail and institutional investors. The rule provides standards for the content, approval, recordkeeping and filing of communications with FINRA. FINRA’s Advertising Regulation Department reviews firms’ advertisements and other communications with the public to ensure they are fair, balanced, not misleading and comply with the standards of the SEC, MSRB, SIPC, and FINRA advertising rules. FINRA rules do not require all communications to be filed, and the figures presented below therefore represent only a segment of such communication.
Figure 2.4.1 Advertising Regulation Filing Volumes, 2019–20231
(Counts as of year-end)
Source: Financial Industry Regulatory Authority.
1Based on communications filed by broker-dealers for review by FINRA's Advertising Regulation Department ("Filings"). The filing requirements were modified in January 2017 as part of a retrospective review of the Communications with the Public Rules, as described in Regulatory Notice 16-41.
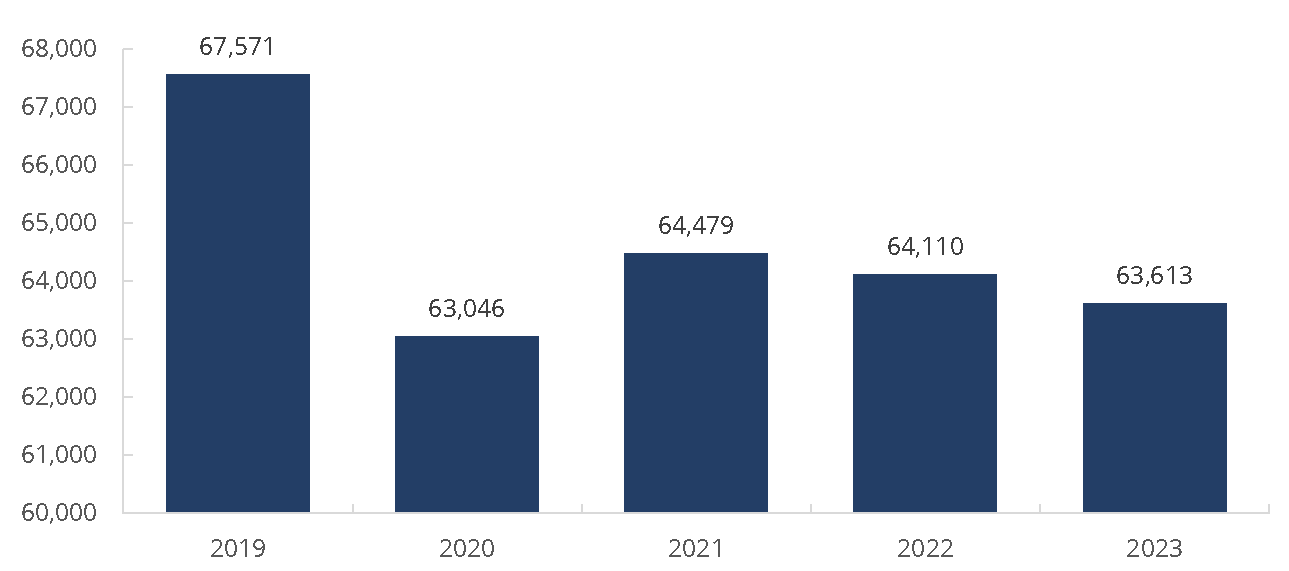
Table 2.4.2 FINRA-Registered Firms – Most Common Marketing Methods Filed with FINRA, 2023
(Counts as of year-end)
Marketing Methods | Total for Period 2023 |
|---|---|
| Web information public access | 25,412 |
| Fund specific information sheet(s) | 15,262 |
| Brochures, pamphlets, & catalogs | 4,499 |
| E-mail, IM, SMS or text messages | 3,734 |
| Flyers & other hand delivered material | 3,605 |
| Periodic & other performance reports | 2,873 |
| Mailed sales material | 1,943 |
| Seminar related communications | 1,697 |
| Audio/Video tapes, CDs & DVDs | 1,147 |
| Information released to the press | 737 |
| Web information password protected | 704 |
| Articles & 3rd party reprints | 513 |
| Software output & IA Tools | 442 |
| Research reports - equity & debt | 367 |
| Print ads, posters, & signs | 337 |
| Acct statement related communications | 113 |
| TV ads & TV broadcasts | 88 |
| Radio ads & radio broadcasts | 73 |
| Broker Dealer use only material | 42 |
| Business related stationery | 13 |
| Telemarketing & other phone scripts | 12 |
| Total | 63,613 |
Source: Financial Industry Regulatory Authority.
Figure 2.4.3 Advertising Regulation Filing Volumes – Registered Investment Company Products, 2023
(Percentage of total filings)
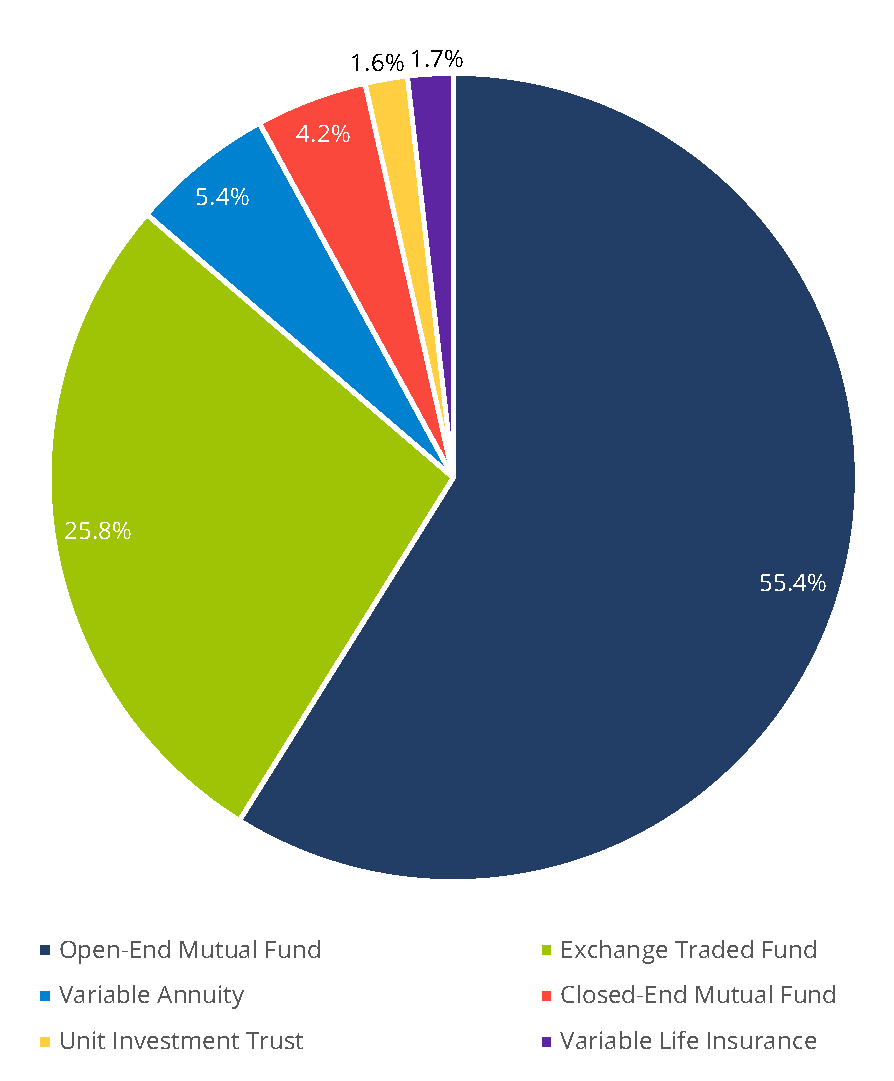
Source: Financial Industry Regulatory Authority.
Table 2.4.4 Advertising Regulation Filing Volumes – Investment Company Products, 2023
| Investment Company Product Types | Percentage of Total Filings |
|---|---|
| Total Registered Investment Company Products | 94.1% |
| Total Non-Registered Investment Company Products | 5.9% |
Source: Financial Industry Regulatory Authority.
Table 2.4.5 Advertising Regulation Filing Volumes – Voluntary vs. Mandatory, 2019–2023
(Counts as of year-end)
2019 | 2020 | 2021 | 2022 | 2023 | |
|---|---|---|---|---|---|
| Mandatory | 55,211 | 52,583 | 54,529 | 55,117 | 55,475 |
| Voluntary | 12,360 | 10,463 | 9,950 | 8,993 | 8,138 |
Source: Financial Industry Regulatory Authority.
2.5 Capital Formation
Figure 2.5.1 Capital Acquisition Brokers and Funding Portals, 2019–20231
(Counts as of year-end)
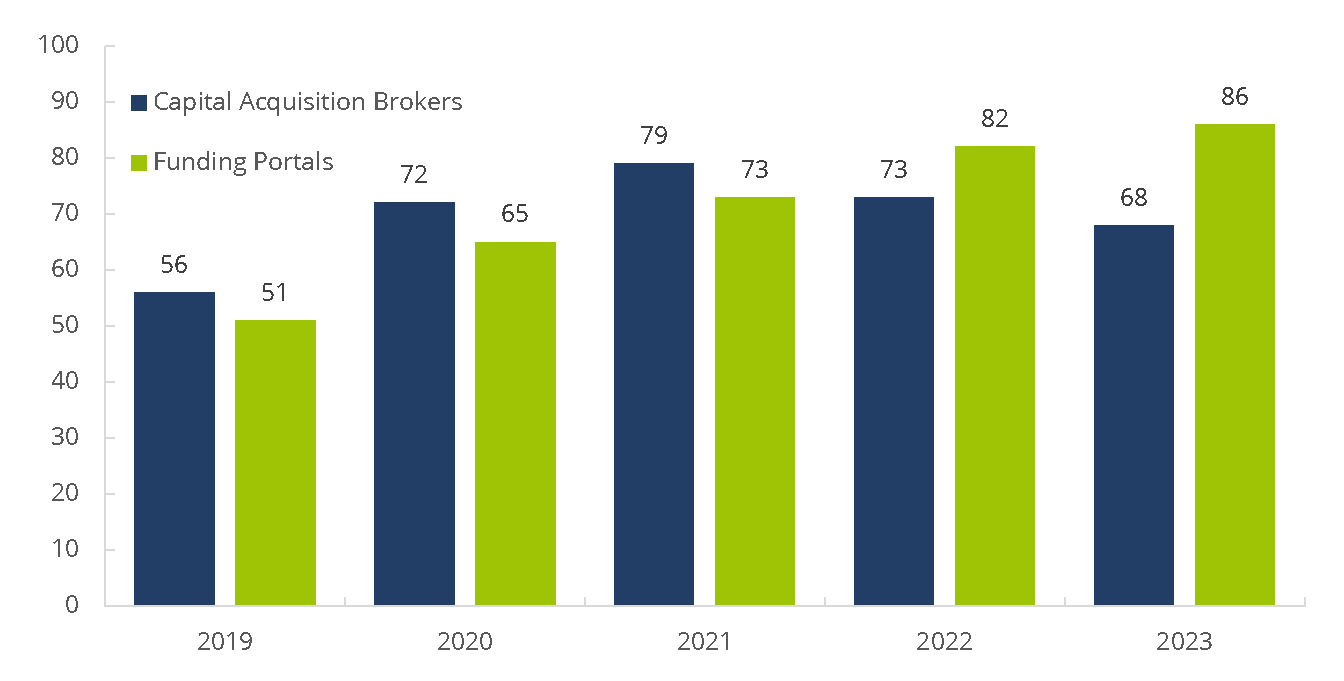
Source: Financial Industry Regulatory Authority.
1Capital Acquisition Brokers (CABs) engage in a limited range of activities, essentially advising companies and private equity funds on capital raising and corporate restructuring, and acting as a placement agent for sales of unregistered securities to institutional investors under limited conditions. The CAB rule took effect in 2017. Funding Portals (FPs) also engage in a limited range of activities: those prescribed under to JOBS Act and the SEC's Regulation Crowdfunding. The FP rule took effect in 2016.
Table 2.5.2 Total Number of Unique Corporate Financing Filings, 2019–20231,2,3
(Counts as of year-end)
| Filing Type | 2019 | 2020 | 2021 | 2022 | 2023 |
|---|---|---|---|---|---|
| Total Public Offerings (FINRA Rule 5110) | 1,604 | 2,304 | 2,901 | 1,398 | 1,104 |
| Member Private Offerings (FINRA Rule 5122) | 60 | 51 | 47 | 45 | 37 |
| Private Placements of Securities (FINRA Rule 5123) | 2,449 | 2,300 | 3,822 | 3,807 | 2,334 |
Source: Financial Industry Regulatory Authority.
*The total number of unique corporate financing filings (not including amendments to filings) received by the Corporate Financing Department.
1FINRA Rule 5110 requires all public offerings in which a member participates to be filed with FINRA for review, except as exempted from the filing requirement under paragraph (h).
2FINRA Rule 5122 requires firms that offer or sell retail private placements of their own securities or that of a control entity to file offering documents and information about the issuer, the offering and the selling firms before the documents are provided to investors, except as exempted from the filing requirements under section (C).
3FINRA Rule 5123 requires firms that sell non-proprietary, retail private placements to file with FINRA's Corporate Financing Department within 15 calendar days of the date of first sale, offering documents and information about the issuer, the offering and the selling firms, except as exempted from the filing requirements under section (B).
2.6 Business Segments
On October 1, 2018, FINRA announced that it was moving toward an exam and risk monitoring program structure that is based on the business models of the firms FINRA oversees. FINRA has grouped firms according to the primary business(es) in which they are engaged. The following tables break down business segments by firm size.
Table 2.6.1 Small Firms – Business Segments as of December 20231
| Firm Grouping | Firm Sub-Grouping* | Number of Firms |
|---|---|---|
| Capital Markets and Investment Banking Services | M&A and Investment Banking | 696 |
| Capital Markets and Investment Banking Services | Private Placements - Institutional Investors | 331 |
| Retail | Retail Small | 323 |
| Trading and Execution | Institutional Brokerage | 247 |
| Retail | Retail Small - Independent Contractor | 200 |
| Retail | Public Pooled Investment Vehicles and Variable Annuities | 200 |
| Retail | Private Placements | 193 |
| Capital Markets and Investment Banking Services | Product Originator and Wholesaler | 188 |
| Capital Markets and Investment Banking Services | Niche/Other - CMIB | 92 |
| Clearing and Carrying | Chaperone - 15a-6 Firms | 73 |
| Diversified | Small Diversified | 69 |
| Retail | Fintech | 69 |
| Trading and Execution | Alternative Trading Systems (ATS) and Electronic Communication Networks (ECN) | 62 |
| Trading and Execution | Medium/Small Proprietary Trading and Market-Making | 42 |
| Capital Markets and Investment Banking Services | Public Finance | 39 |
| Retail | Retail with Carrying/Clearing Activities | 35 |
| Clearing and Carrying | Securities Financing Book | 20 |
| Clearing and Carrying | Correspondent Clearing | 18 |
| Clearing and Carrying | Niche/Other - Clearing | 15 |
| Trading and Execution | Large Proprietary Trading and Market-Making | 13 |
| Diversified | Medium Diversified - Carrying/Clearing | 9 |
| Retail | Retail Mid-Size & Large - Independent Contractor | 5 |
| Diversified | Medium Diversified - Non-Carrying/Clearing | 4 |
| Diversified | Large Diversified | 1 |
| Retail | Retail Mid-Size & Large | 1 |
| Total | 2,945 |
Source: Financial Industry Regulatory Authority.
*The definition of firm size in FINRA’s By-Laws may differ from the Member Firm Business Segment definitions, which may consider total assets and/or total revenue in categorizing a firm.
1Small Firm = 1-150 registered representatives.
Table 2.6.2 Mid-Size Firms – Business Segments as of December 20231
| Firm Grouping | Firm Sub-Grouping* | Number of Firms |
|---|---|---|
| Capital Markets and Investment Banking Services | Product Originator and Wholesaler | 50 |
| Retail | Retail Mid-Size & Large - Independent Contractor | 49 |
| Capital Markets and Investment Banking Services | M&A and Investment Banking | 14 |
| Diversified | Medium Diversified - Carrying/Clearing | 13 |
| Retail | Public Pooled Investment Vehicles and Variable Annuities | 13 |
| Retail | Retail Mid-Size & Large | 12 |
| Diversified | Medium Diversified - Non-Carrying/Clearing | 10 |
| Trading and Execution | Institutional Brokerage | 10 |
| Diversified | Small Diversified | 7 |
| Trading and Execution | Large Proprietary Trading and Market-Making | 4 |
| Clearing and Carrying | Correspondent Clearing | 3 |
| Trading and Execution | Medium/Small Proprietary Trading and Market-Making | 3 |
| Retail | Fintech | 2 |
| Retail | Private Placements | 2 |
| Capital Markets and Investment Banking Services | Public Finance | 1 |
| Clearing and Carrying | Chaperone - 15a-6 Firms | 1 |
| Diversified | Large Diversified | 1 |
| Retail | Retail Small - Independent Contractor | 1 |
| Retail | Retail Small | 1 |
| Trading and Execution | Alternative Trading Systems (ATS) and Electronic Communication Networks (ECN) | 1 |
| Total | 198 |
Source: Financial Industry Regulatory Authority.
*The definition of firm size in FINRA’s By-Laws may differ from the Member Firm Business Segment definitions, which may consider total assets and/or total revenue in categorizing a firm.
1Mid-Size Firm = 151-499 registered representatives.
Table 2.6.3 Large Firms – Business Segments as of December 20231
| Firm Grouping | Firm Sub-Grouping* | Number of Firms |
|---|---|---|
| Retail | Retail Mid-Size & Large - Independent Contractor | 33 |
| Retail | Public Pooled Investment Vehicles and Variable Annuities | 27 |
| Diversified | Medium Diversified - Carrying/Clearing | 25 |
| Capital Markets and Investment Banking Services | Product Originator and Wholesaler | 20 |
| Retail | Retail Mid-Size & Large | 16 |
| Diversified | Large Diversified | 12 |
| Retail | Retail with Carrying/Clearing Activities | 7 |
| Diversified | Medium Diversified - Non-Carrying/Clearing | 5 |
| Capital Markets and Investment Banking Services | M&A and Investment Banking | 3 |
| Clearing and Carrying | Correspondent Clearing | 2 |
| Trading and Execution | Large Proprietary Trading and Market-Making | 2 |
| Capital Markets and Investment Banking Services | Private Placements - Institutional Investors | 1 |
| Retail | Private Placements | 1 |
| Trading and Execution | Institutional Brokerage | 1 |
| Total | 155 |
Source: Financial Industry Regulatory Authority.
*The definition of firm size in FINRA’s By-Laws may differ from the Member Firm Business Segment definitions, which may consider total assets and/or total revenue in categorizing a firm.
1Large Firm = 500 or more registered representatives.
2.7 Financials
Figure 2.7.1 Excess Net Capital By Firm Size, 2019-2023
(In billions of U.S. dollars as of year-end)
Source: Financial Industry Regulatory Authority.
Figure 2.7.2 FINRA-Registered Firms – Total Revenues and Expenses, 2019−2023
(In millions of U.S. dollars as of year-end)
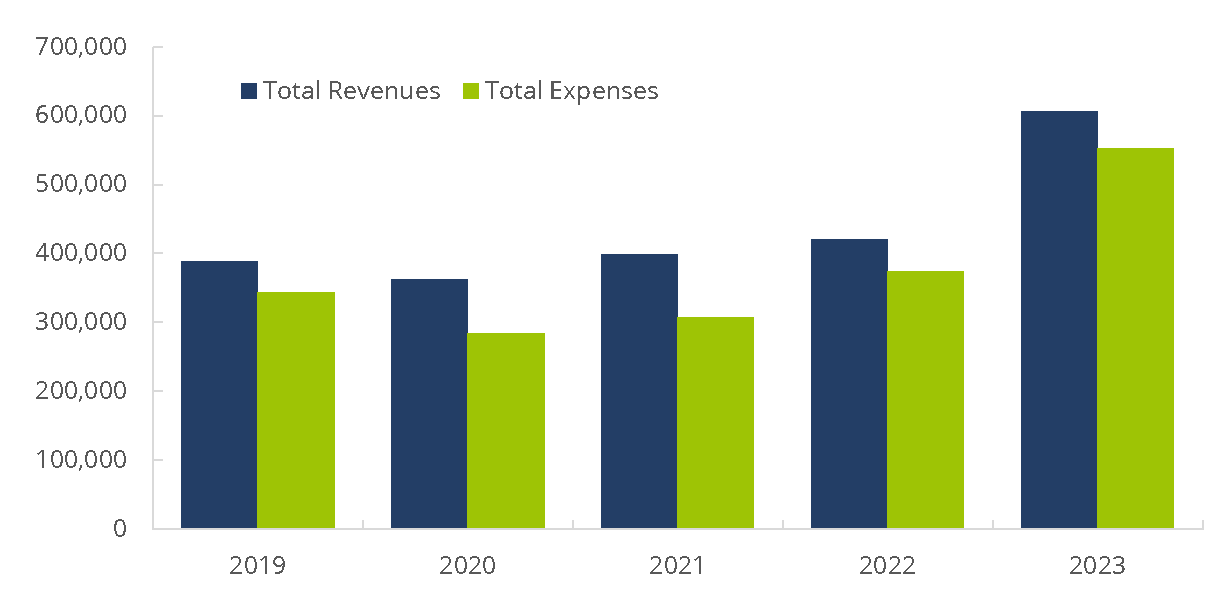
Source: Financial and Operational Combined Uniform Single (FOCUS) Reports.
Table 2.7.3 FINRA-Registered Firms – Aggregate Financial Information, 2019–2023
(In millions of U.S. dollars as of year-end)
2019 | 2020 | 2021 | 2022 | 2023 | |
|---|---|---|---|---|---|
| Total Revenues | $388,153.64 | $361,954.09 | $398,543.90 | $421,262.51 | $605,750.92 |
| Total Expenses | $344,209.98 | $284,684.68 | $306,909.14 | $373,947.58 | $552,059.55 |
| Pre-Tax Net Income | $43,943.66 | $77,269.41 | $91,634.76 | $47,314.93 | $53,691.37 |
Source: Financial and Operational Combined Uniform Single (FOCUS) Reports.